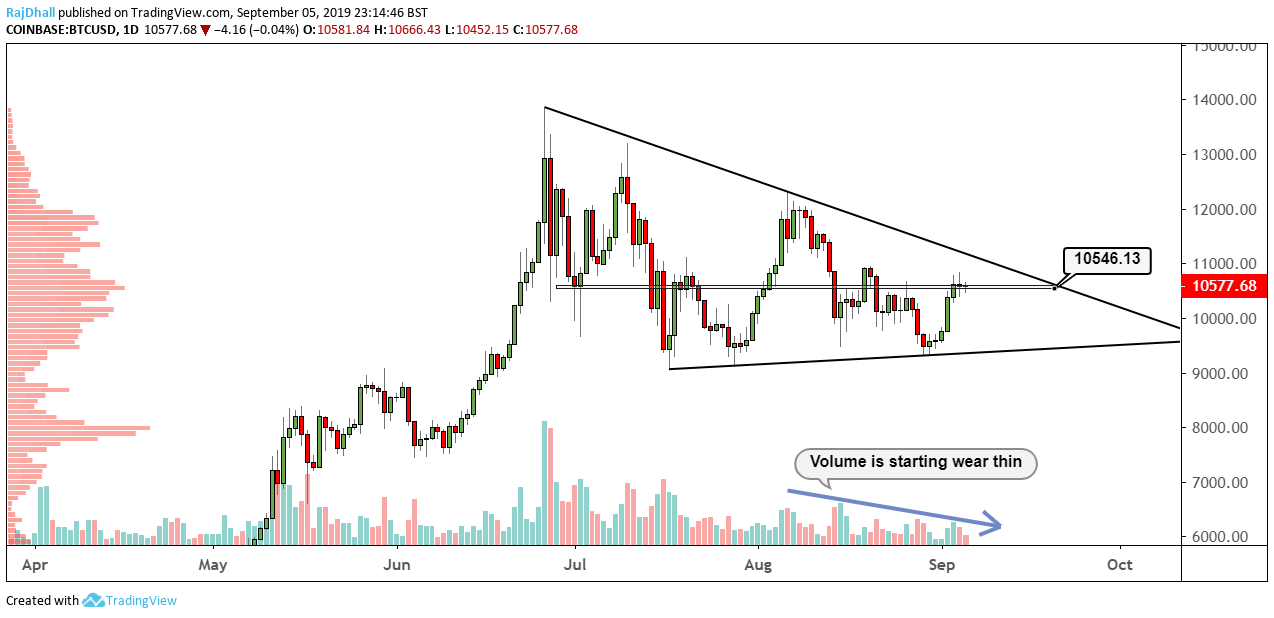
- Bitcoin has been stuck in a consolidation phase and trades 0.09% lower.
- There is a trendline on the intraday chart but 10,500 held firm.
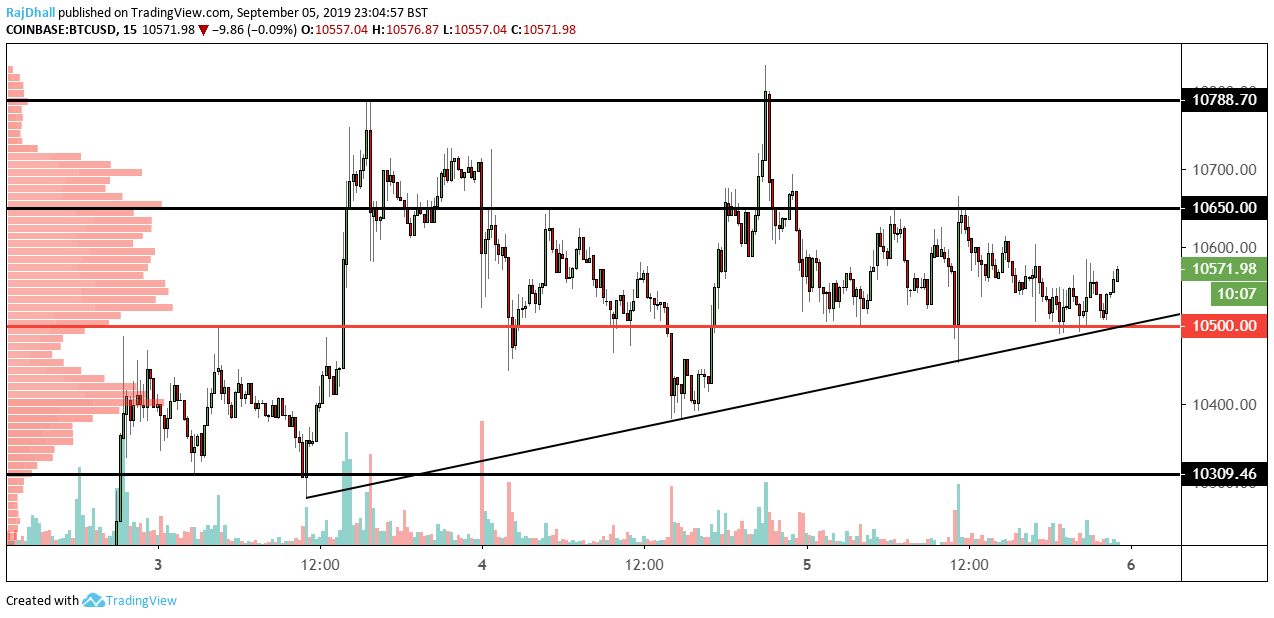
Today’s Bitcoin price action has been sideways but the dropped stalled at the key support level at 10,500.
There is trendline marked on the 15-minute chart above that could be important later.
On the upside, resistance is at 10,650 and 10,788-800 close to the intraday high.
On the downside, the major support levels are at 10,500 as mentioned and 10,309.
As Asian traders come to the market the price has started to move higher but not with too much volume (as of yet).
On the daily chart below, there has been a triangle chart pattern forming. As you can see by the volume at the bottom of the chart traders are losing momentum as we get closer to a defining detection phase.