- Bitcoin price on Thursday is trading in very minor positive territory holding gains of some 0.40%.
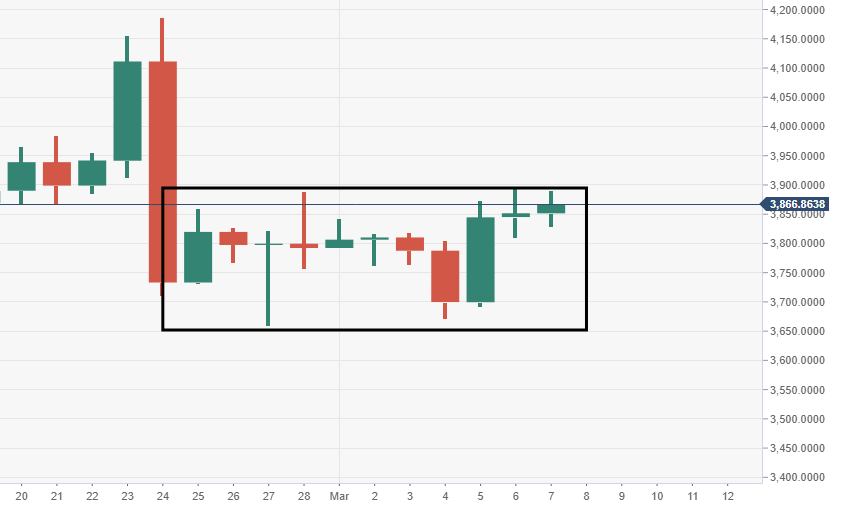
- BTC/USD price continues to move within a deadly bearish flag formation, subject to a breakout south.
- If the lower part of the current daily range, $3600 area sees a breach, then a chunky wave of selling pressure may follow.
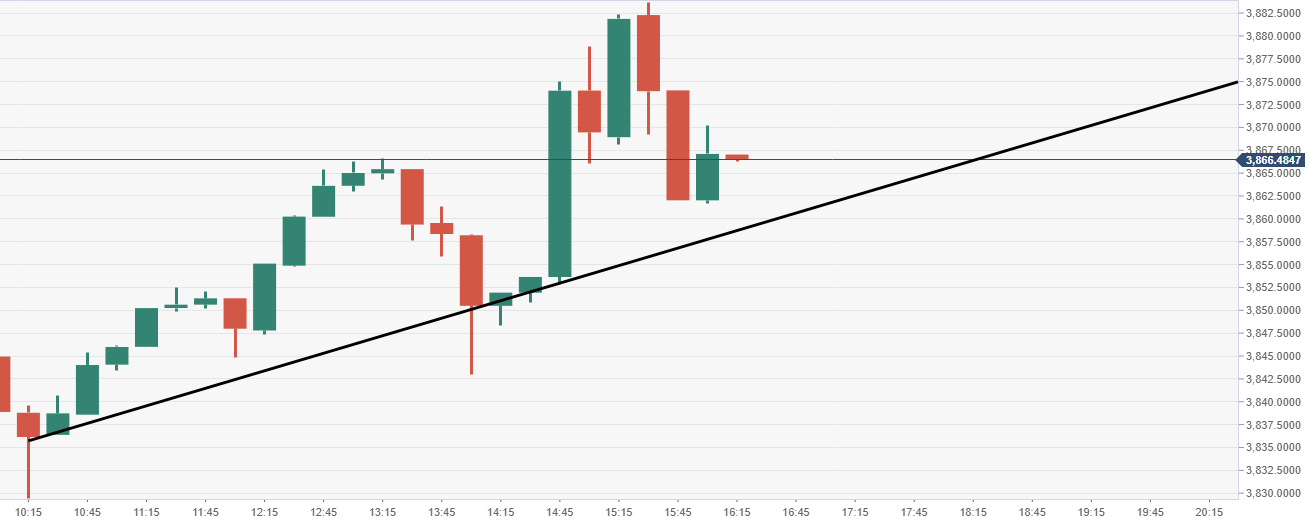
BTC/USD 15-minute chart
- Ascending trend line near-term is supporting the price and preventing a fresh bout of selling pressure.
Spot rate: 3867.62
Relative change: +0.43%
High: 3890.02
Low: 3829.47
Trend: Neutral
Trends:
Daily SMA20: 3791.34
Daily SMA50: 3631.43
Daily SMA100: 3700.09
Daily SMA200: 5048.33
Levels:
Previous Daily High: 3893.15
Previous Daily Low: 3810.31
Previous Weekly High: 4187.25
Previous Weekly Low: 3659.1
Previous Monthly High: 4187.25
Previous Monthly Low: 3338.98
Daily Fibonacci 38.2%: 3861.5
Daily Fibonacci 61.8%: 3841.96
Daily Pivot Point S1: 3810.21
Daily Pivot Point S2: 3768.84
Daily Pivot Point S3: 3727.37
Daily Pivot Point R1: 3893.05
Daily Pivot Point R2: 3934.52
Daily Pivot Point R3: 3975.89
BTC/USD 4-daily chart
- BTC/USD remains vulnerable given the current bearish flag formation via daily chart.