- Bitcoin price is trading in negative territory, down some 2.70% in the second half of the session.
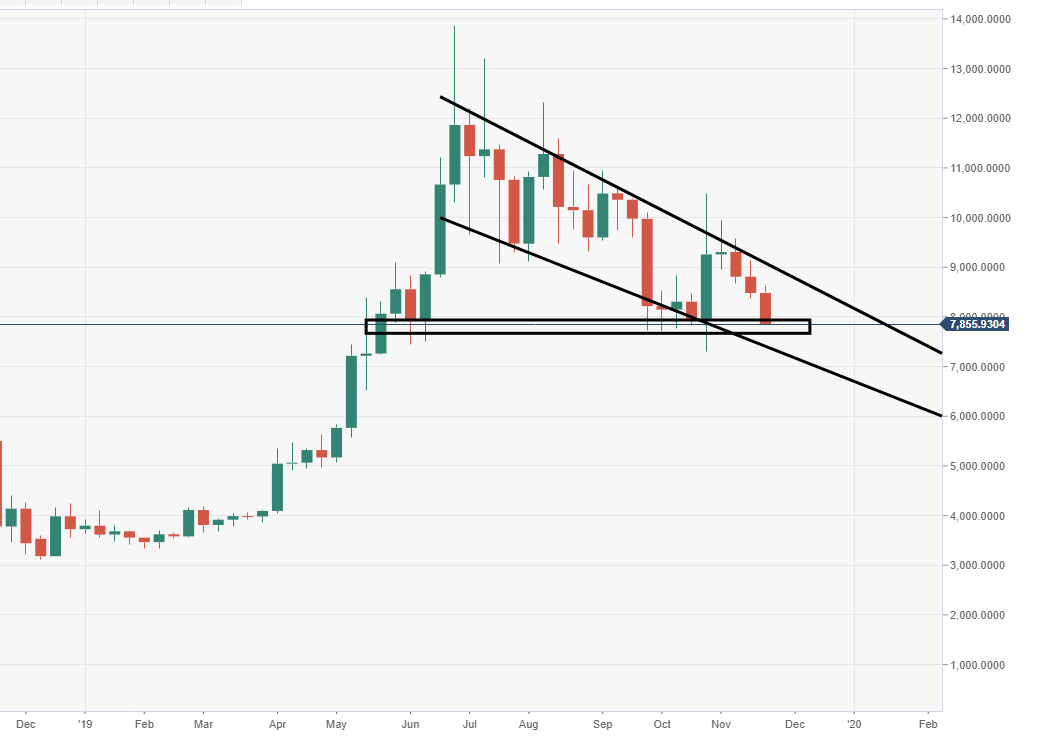
- BTC/USD daily price acting is moving within a descending channel structure.
- The price is running towards its fourth consecutive session in the red.
BTC/USD weekly chart
The bears are pressing Bitcoin towards its third consecutive week in the red.
BTC/USD daily chart
Price action is forcing a breakout below the game-changing $8000 mark, a closure below could be devastating.
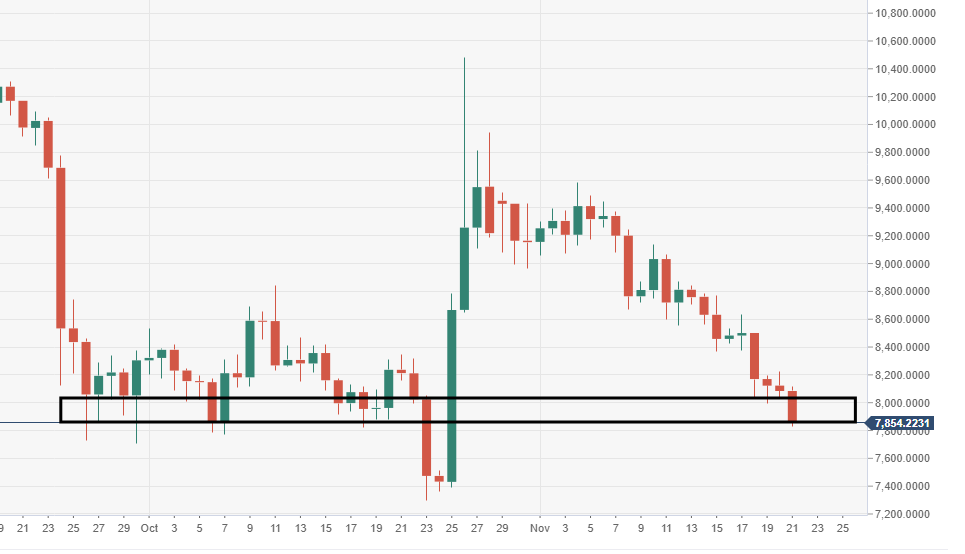
Spot rate: 7,856.48
Relative change: -2.70%
High: 8,114.53
Low: 7,826.36
