- Bitcoin price on Monday trading down with marginal gains of 1%, after the huge surge on Sunday.
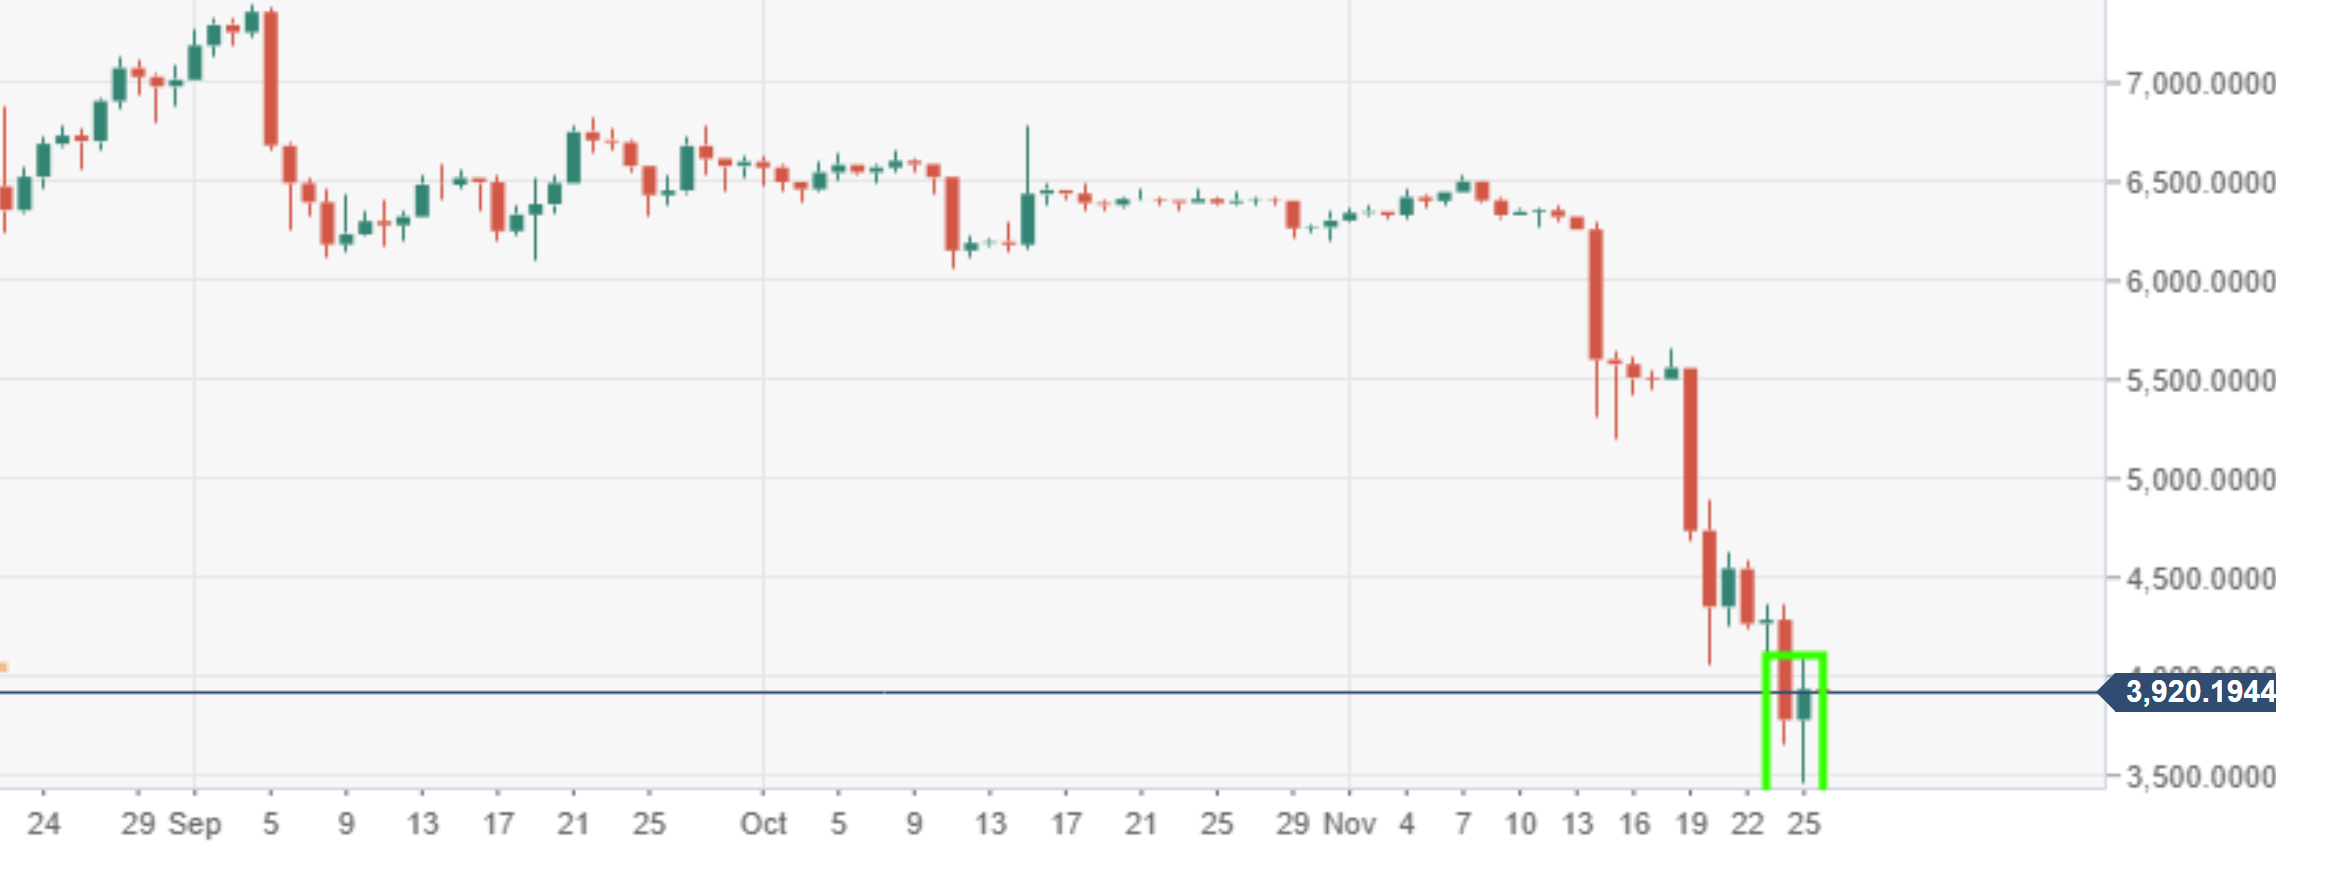
- BTC/USD has formed a chunky looking bullish reversal candlestick, with that push seen during the session on 25th November.
- Next big challenge for the bulls will be to smash back through $4500 price region.
BTC/USD daily chart
Spot rate: 3908.44
Relative change: -0.95%
High: 4075.10
Low: 3978.31
Trend: Bearish/Neutral
Support 1: 3880.00, lower part part of recent range block.
Support 2: 3563.52, daily pivot point support.
Support 3: 3191.27, daily pivot point support.
Resistance 1: 4092.97, upper part of range block.
Resistance 2: 4211.44, daily pivot point resistance.
Resistance 3: 4487.10, daily pivot point resistance.
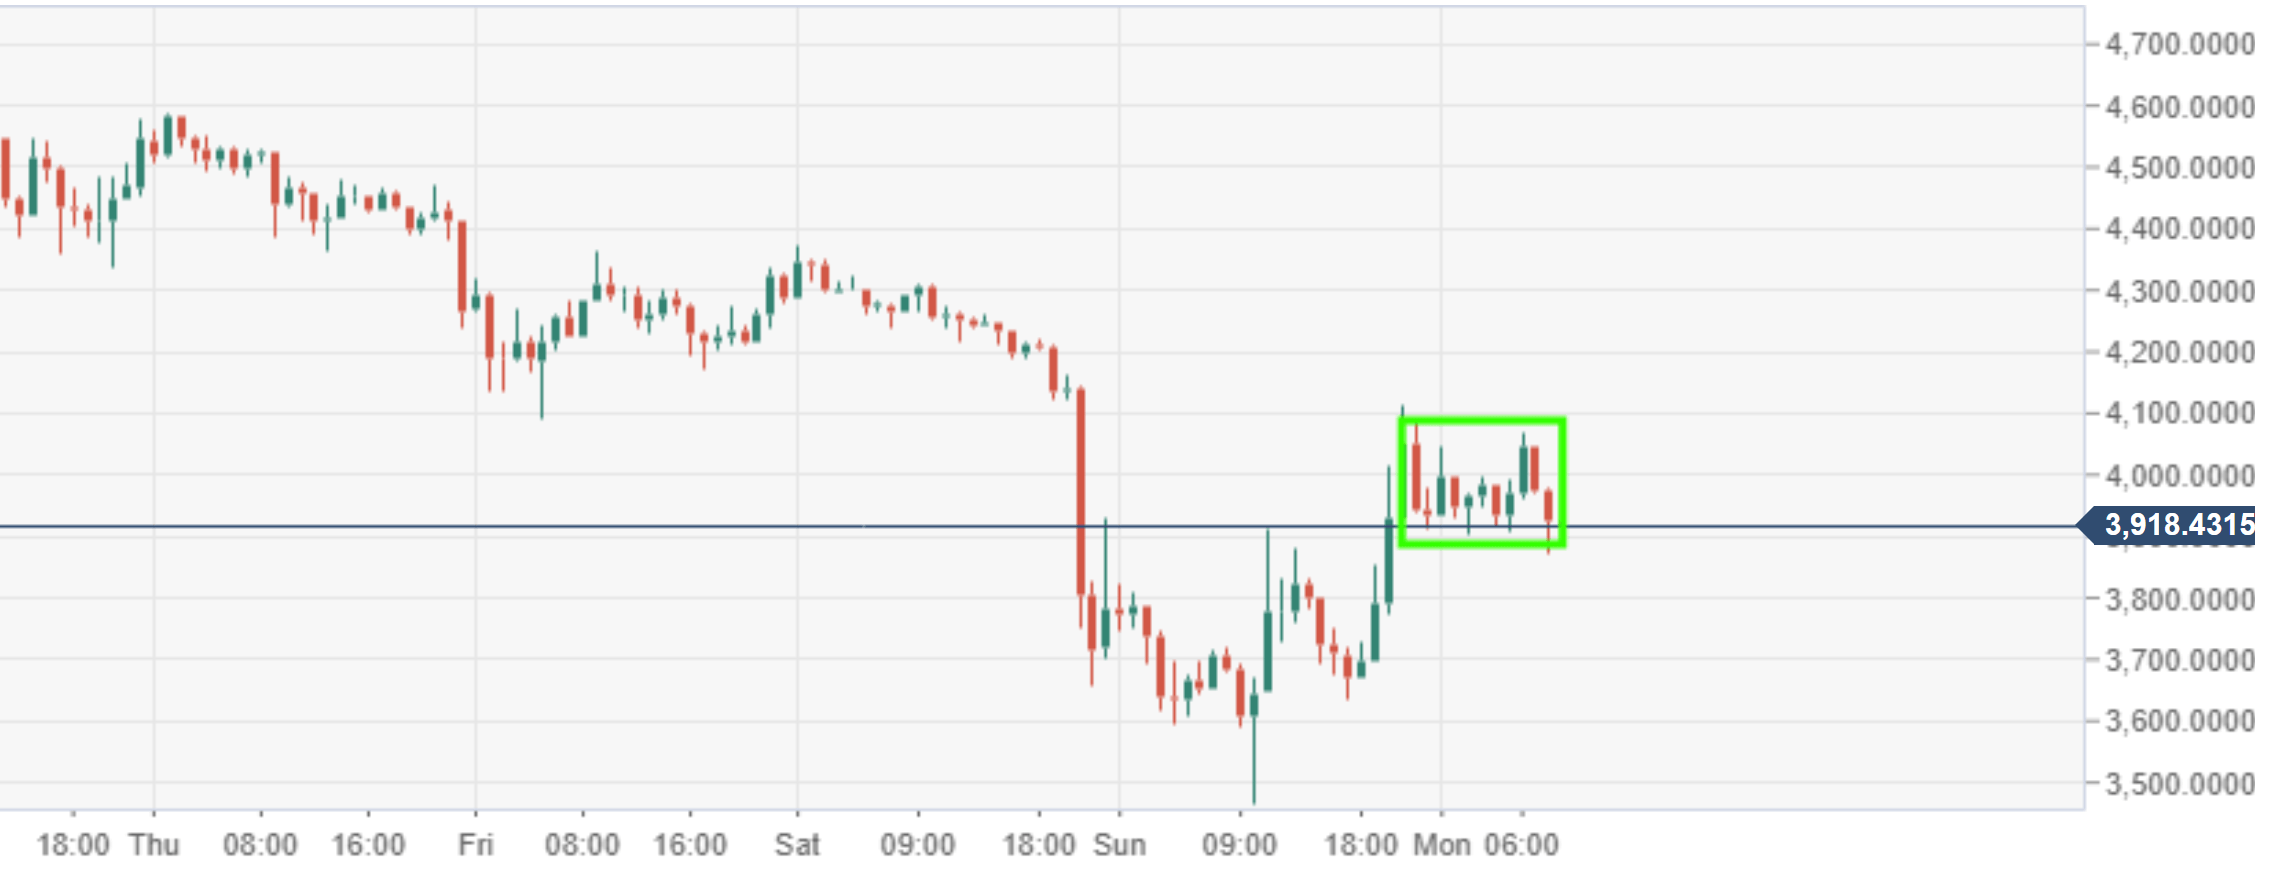
BTC/USD 60-minute chart
- Price action over the 60-minute chart view has formed a near-term range block, subject to an extended move north.