- Bitcoin price on Thursday late in the session is nursing losses of some 0.90%.
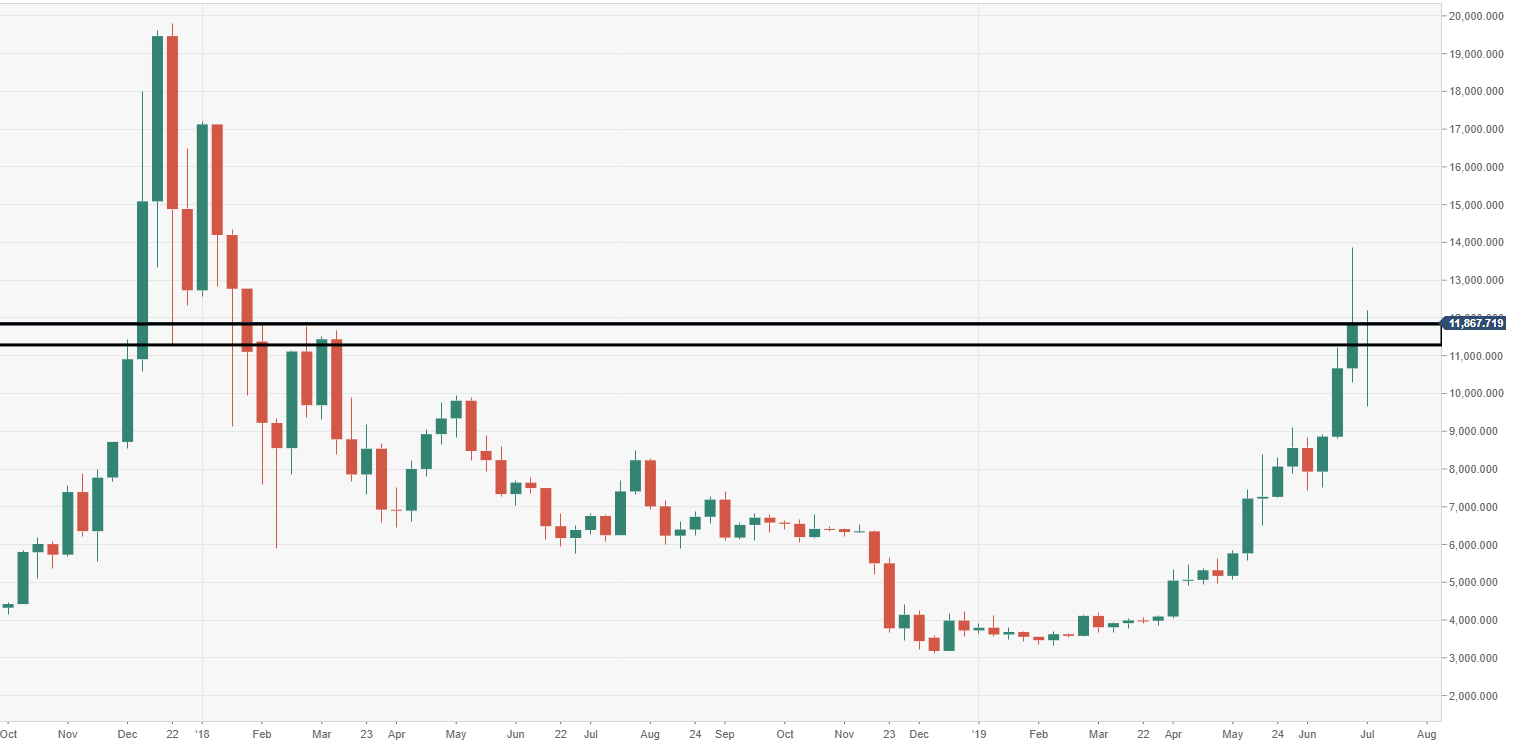
- BTC/USD price action via the weekly is running towards its fourth consecutive week in the green.
- Should the bulls push for a weekly closure above $12,000 it could open the door for a fast move up to $15,000 territory.
Spot rate: 11,858.56
Relative change: -0.88%
High: 12,198.80
Low: 9,657.12
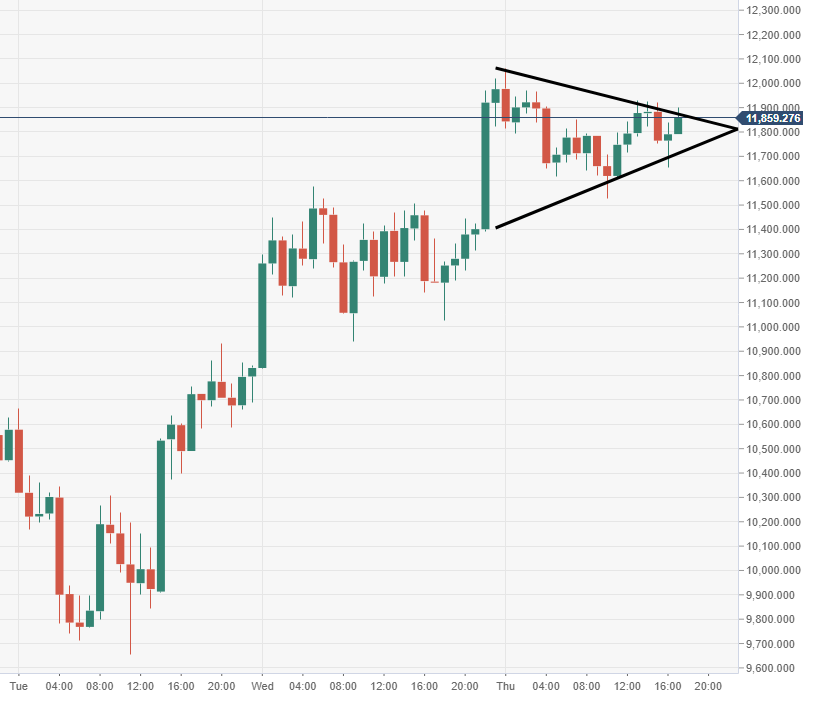
BTC/USD 60-minute chart
- Near-term price action via the 60-minute chart view is moving within a pennant structure.
BTC/USD weekly chart
- There is a large weekly barrier at $12,000. which must be broken down for greater upside pressure.