- Bitcoin price is trading in positive territory, up 0.40% in the second half of the session.
- BTC/USD has some momentum back in favour of the market bulls.
- Price action produced a double bottom formation via the daily chart view.
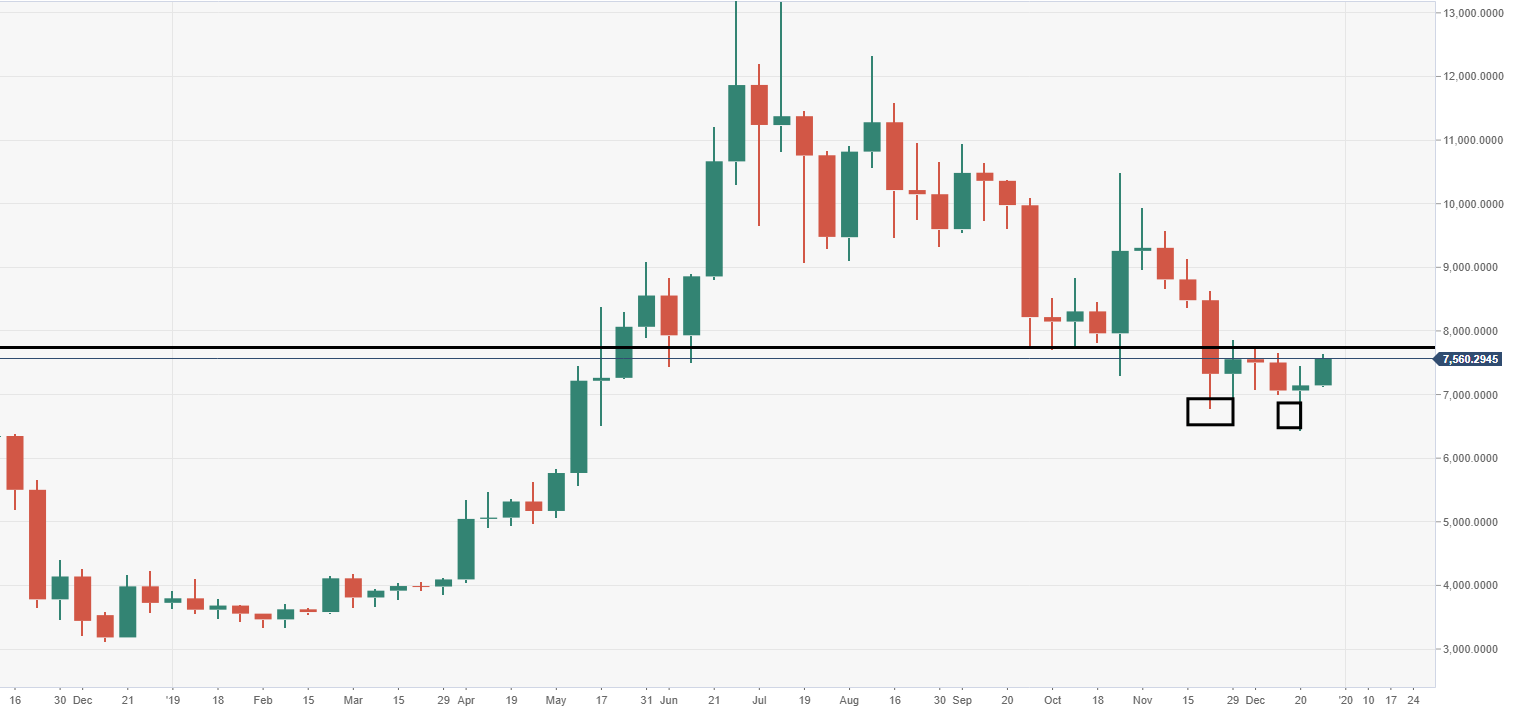
BTC/USD weekly chart
Critical weekly resistance can be observed around the $7700-800 range, in line with the double bottom neckline.
BTC/USD daily chart
A daily double bottom formation is eyed via the daily chart view, the bulls are pressing towards the neckline, tracking at around $7750.
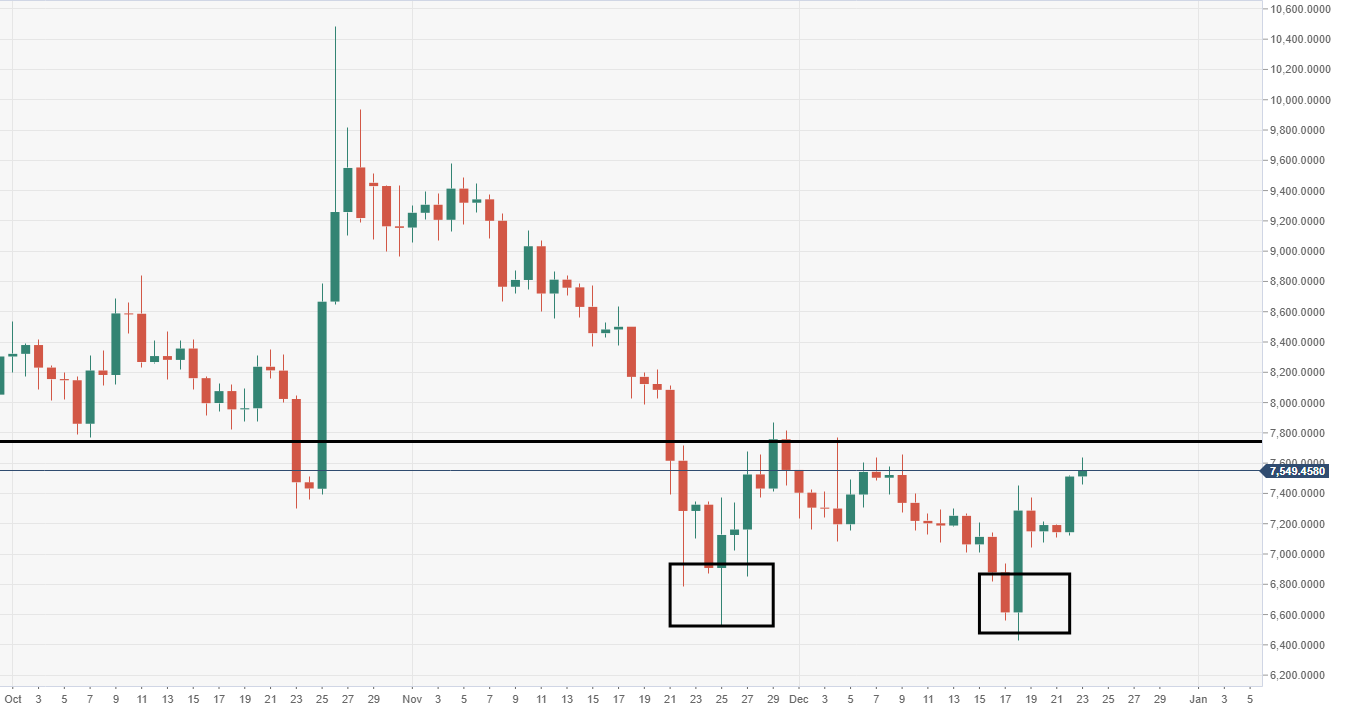
Spot rate: 7550.85
Relative change: +0.55%
High: 7639.83
Low: 7461.63
