- Bitcoin price is trading in positive territory, up some 3.60% in the second half of the session.
- BTC/USD has aggressively been pushing to the downside since 27 October.
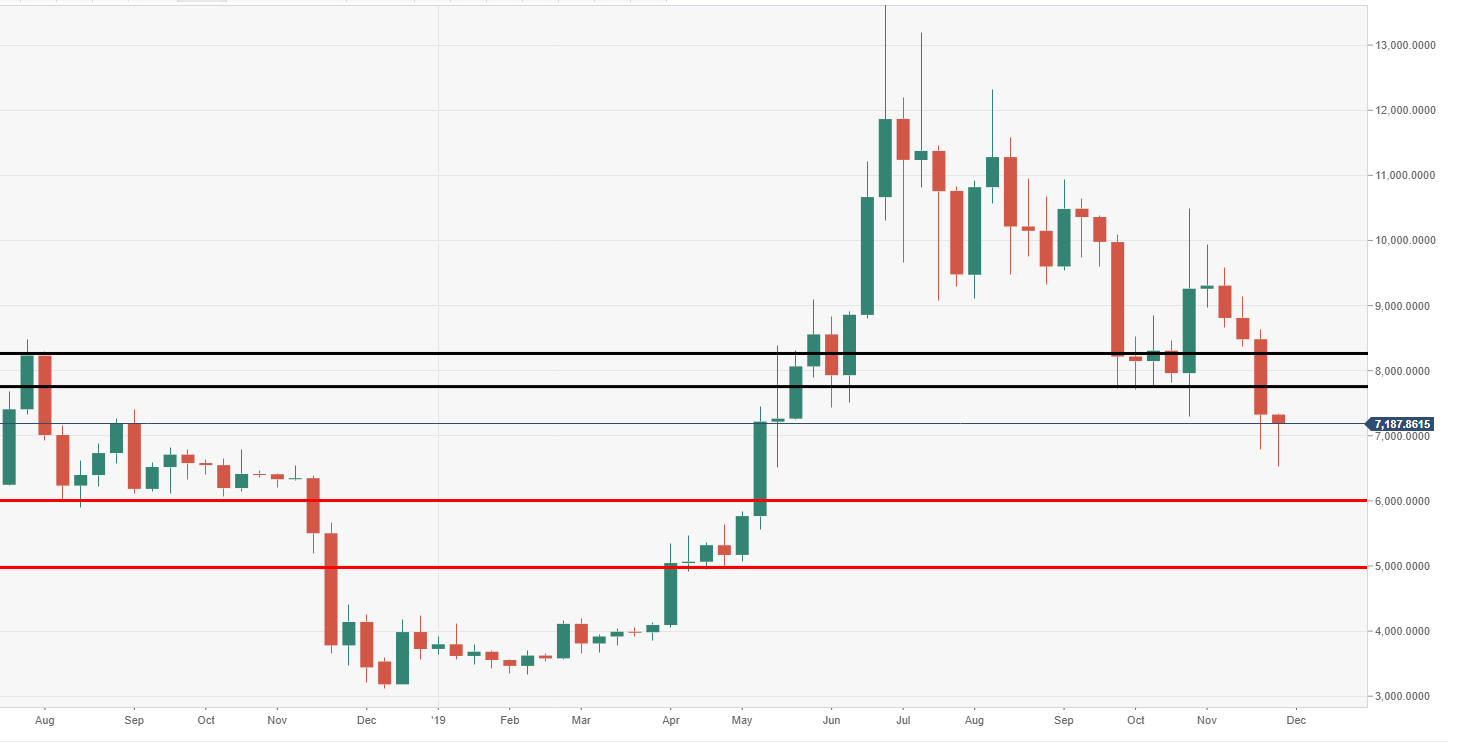
- The price remains at risk of falling to the next major demand area at $5000.
BTC/USD weekly chart
The price is running towards its fourth consecutive week in the red.
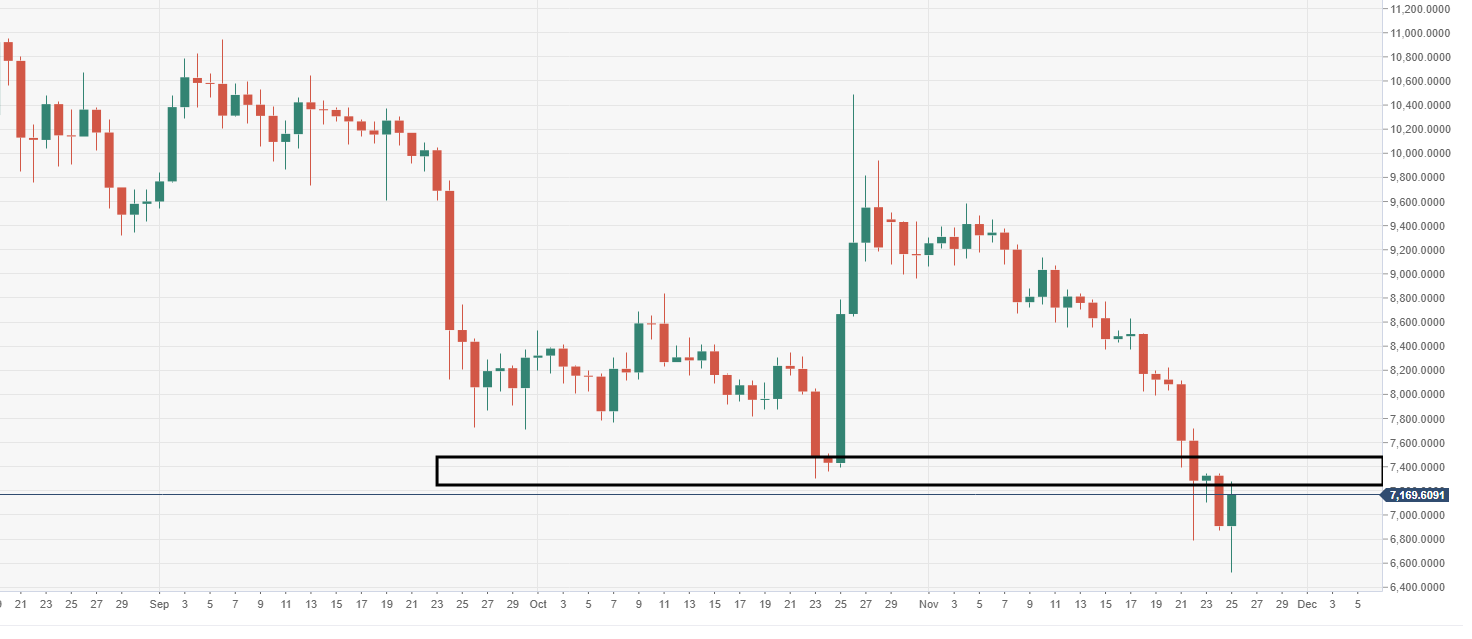
BTC/USD daily chart
Price action is moving within a critical demand zone, $7300-6900, a break could invite a fresh wave of selling.
Spot rate: 7156.42
Relative change: +3.60%
High: 7276.19
Low: 6,526.81
