- Bitcoin price on Friday down over 2%, after after further bloodshed was seen late Thursday.
- BTC/USD price action is moving within a descending channel formation. Support being found at the lower trend line.
BTC/USD 4-hour chart
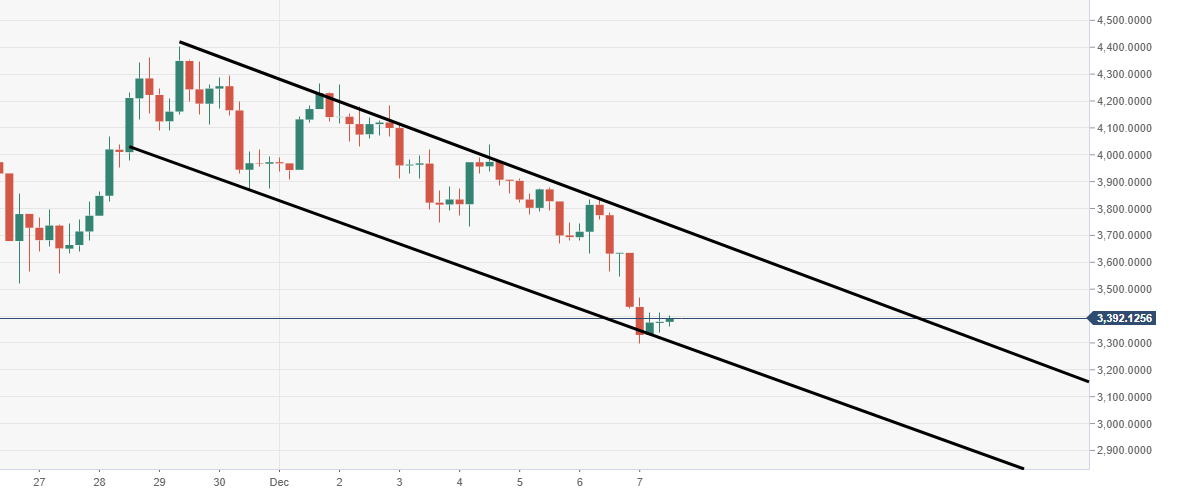
Spot rate: 3398.16
Relative change: -2.23%
High: 3841.59
Low: 3299.73
Trend: Bearish
Support 1: 3314.61, lower part of channel.
Support 2: 3294.06, daily pivot point support.
Support 3: 3153.71, psychological support.
Resistance 1: 3708.18, upper part of channel & daily pivot point resistance.
Resistance 2: 3981.95, daily pivot point resistance.
Resistance 3: 4122.30, daily pivot point resistance.
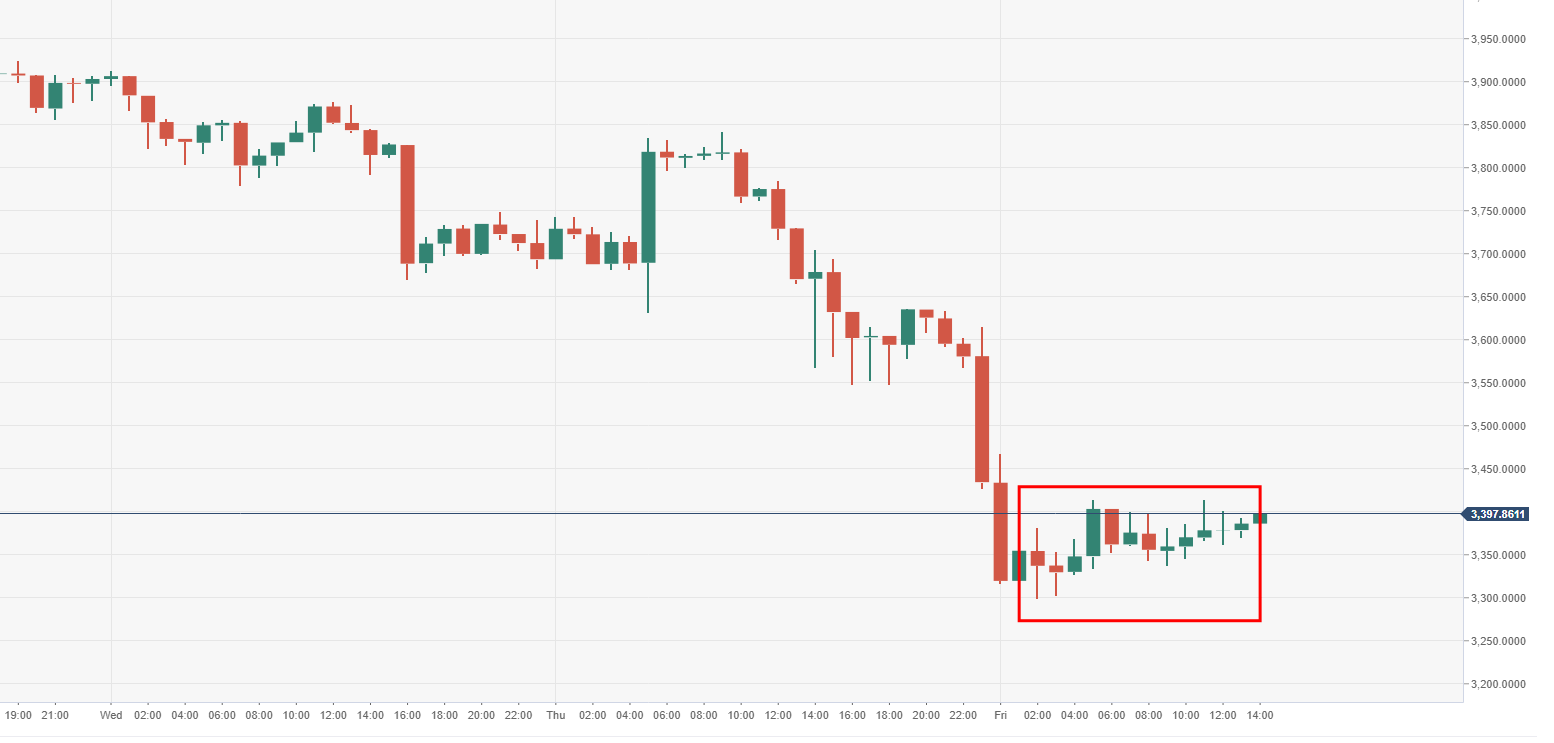
BTC/USD 60-minute chart
- Price is consolidation as seen via the 60-minute chart, following the hard fall. Moving within a range-block, subject to another potential extended move lower.