- Bitcoin was seen down marginally just shy of 1% on Monday, supported by a decent demand zone.
- BTC/USD is within consolidation mode, after the chunky rally late on Friday.
- A bullish flag pattern has formed with the recent price behavior, a jump higher looks imminent.
BTC/USD 60-minute chart
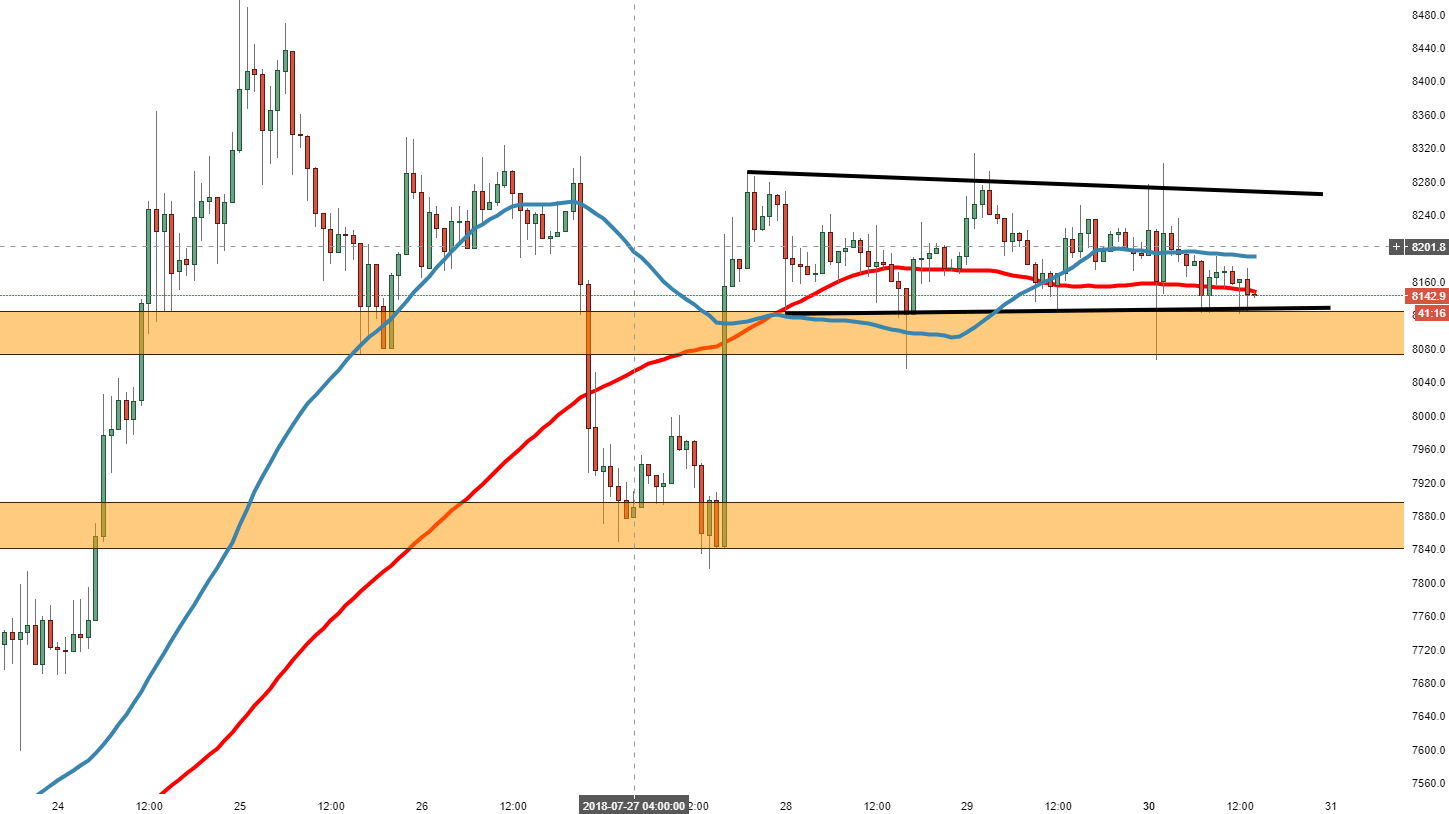
Spot rate: 8145.0
Relative change: -0.93%
High: 8301.7
Low: 8065.1
Trend: Neutral/Bearish
Support 1: 8144.0, 100MA.
Support 2: 8127.6, lower part of bull flag.
Support 3: 8120-8080, demand zone.
Resistance 1: 8188.7, 50MA.
Resistance 2: 8264.0, upper part of bull flag.
Resistance 3: 8300.0, heavy supply area, as seen from 26th July to date.
