- Bitcoin price on Monday was seen nursing minor losses of around 1%, as price action continues to range.
- BTC/USD price action is moving within a narrow fashion, swinging between $6100 as a low up to $6600.
- Bitcoin’s current movement could be forming what looks to be a large bearish flag potentially, after the huge drop on 5th September.
BTC/USD 60-minute chart
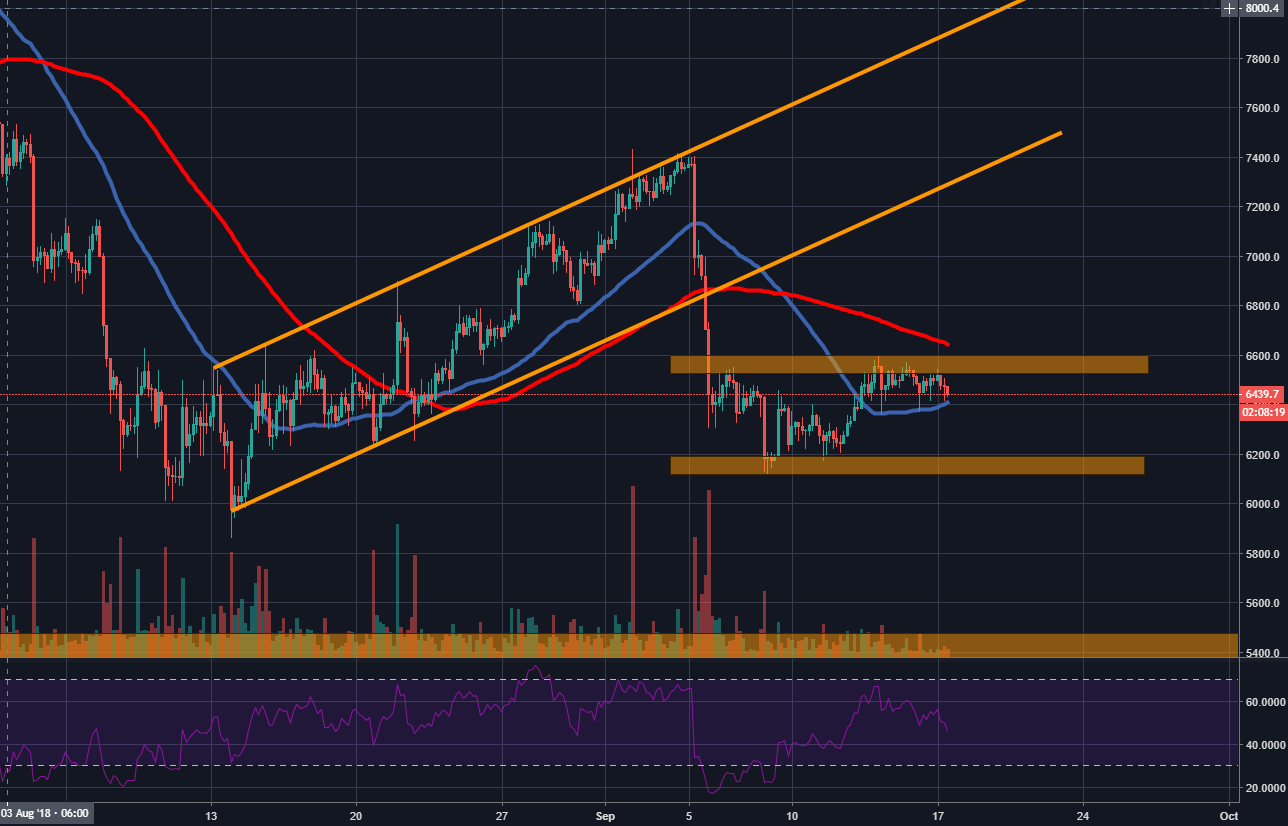
Spot rate: 6439.7
Relative change: -0.95%
High: 6543.3
Low: 6414.2
Trend: Bearish
Support 1: 6410.0, support on 4-hour chart & 50MA.
Support 2: 6190.0, key demand zone.
Support 3: 5863.4, 14th August low.
Resistance 1: 6530.0, supply zone.
Resistance 2: 6600.0, top of current range.
Resistance 3: 6635.0, 100MA (4-hour)
