- Bitcoin regathers some faster paced momentum, as it looks to break down resistance barrier just ahead.
- BTC/USD price actions has been moving within an ascending wedge pattern, over the past two sessions.
- A chunky supply zone can be seen within the very early $7600 region, which has been causing problems since 24th May.
BTC/USD 30-minute chart
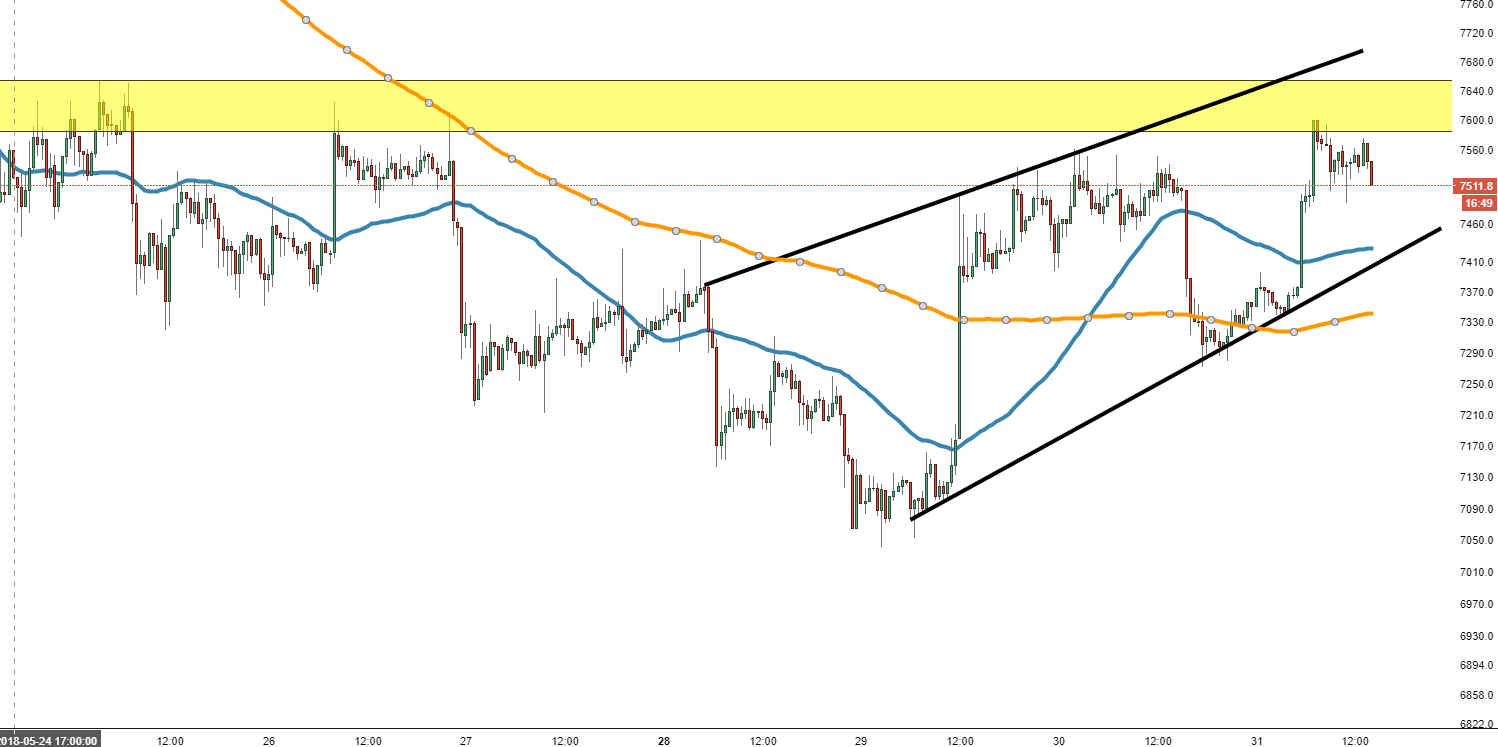
Spot rate: 7530
Relative change: +2.00%
High: 7600
Low: 7340
Trend: Bullish
Resistance 1: 7600, chunky supply zone.
Resistance 2: 7730, 24th May high.
Resistance 3: 7933, 23rd May high, before price dumped 6%.
Support 1: 7430, 50MA.
Support 3: 7340, 200MA.
