Home Bitcoin Technical Analysis: BTC/USD recent price behavior looks like further potential trouble is in the waiting, as bears buckle up
Crypto News

Bitcoin Technical Analysis: BTC/USD recent price behavior looks like further potential trouble is in the waiting, as bears buckle up

  • Bitcoin is currently going through another session of trading in the red, nursing losses of over 2%.  
  • BTC/USD price action within its consolidation mode, has formed a bearish pennant pattern.  


BTC/USD 60-minute chart
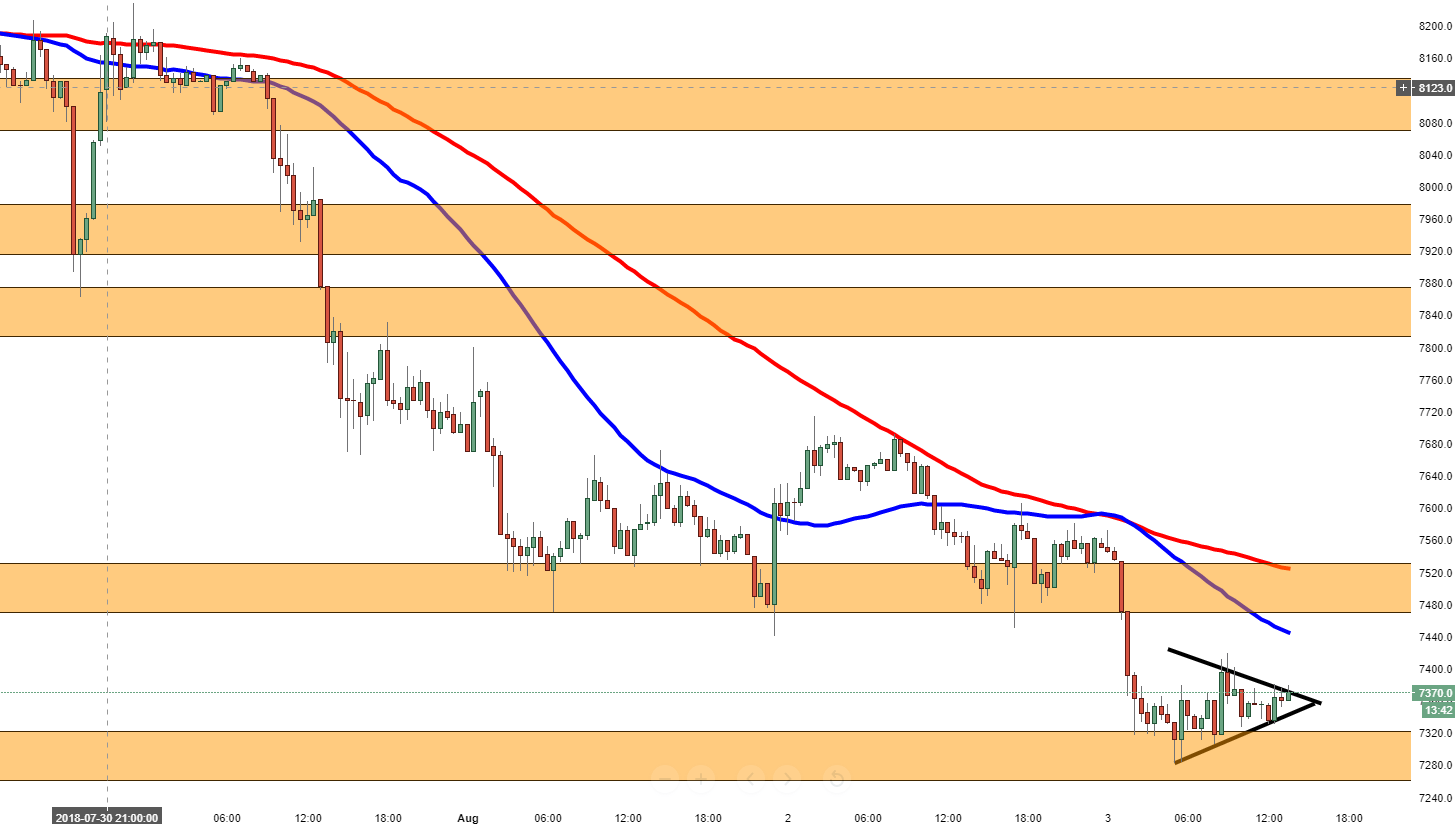


Spot rate:                    7370.1

Relative change:        -2.20%

High:                          7533.3

Low:                           7282.1

Trend:                         Bearish


Support 1:                  7341.5, lower part of pennant.  

Support 2:                  7320.4, demand zone.  

Support 3:                  7282.1, today’s (Friday) low.  

Resistance 1:             7376.4, upper  part of pennant.  

Resistance 2:             7442.3, 50MA.

Resistance 3:             7475.5, supply zone.  


FX Street

FX Street

FXStreet is the leading independent portal dedicated to the Foreign Exchange (Forex) market. It was launched in 2000 and the portal has always been proud of their unyielding commitment to provide objective and unbiased information, to enable their users to take better and more confident decisions.