- Bitcoin price is back in consolidation mode on Tuesday, trading down marginally by 0.10%.
- Bears easing off the selling pressure that was observed during Monday’s session.
- Price action has formed a rising wedge pattern, as seen on the 60-minute time frame.
- Downside pressure still potentially looms for Bitcoin, with resumption of selling remaining a possibility.
BTC/USD 60-minute chart
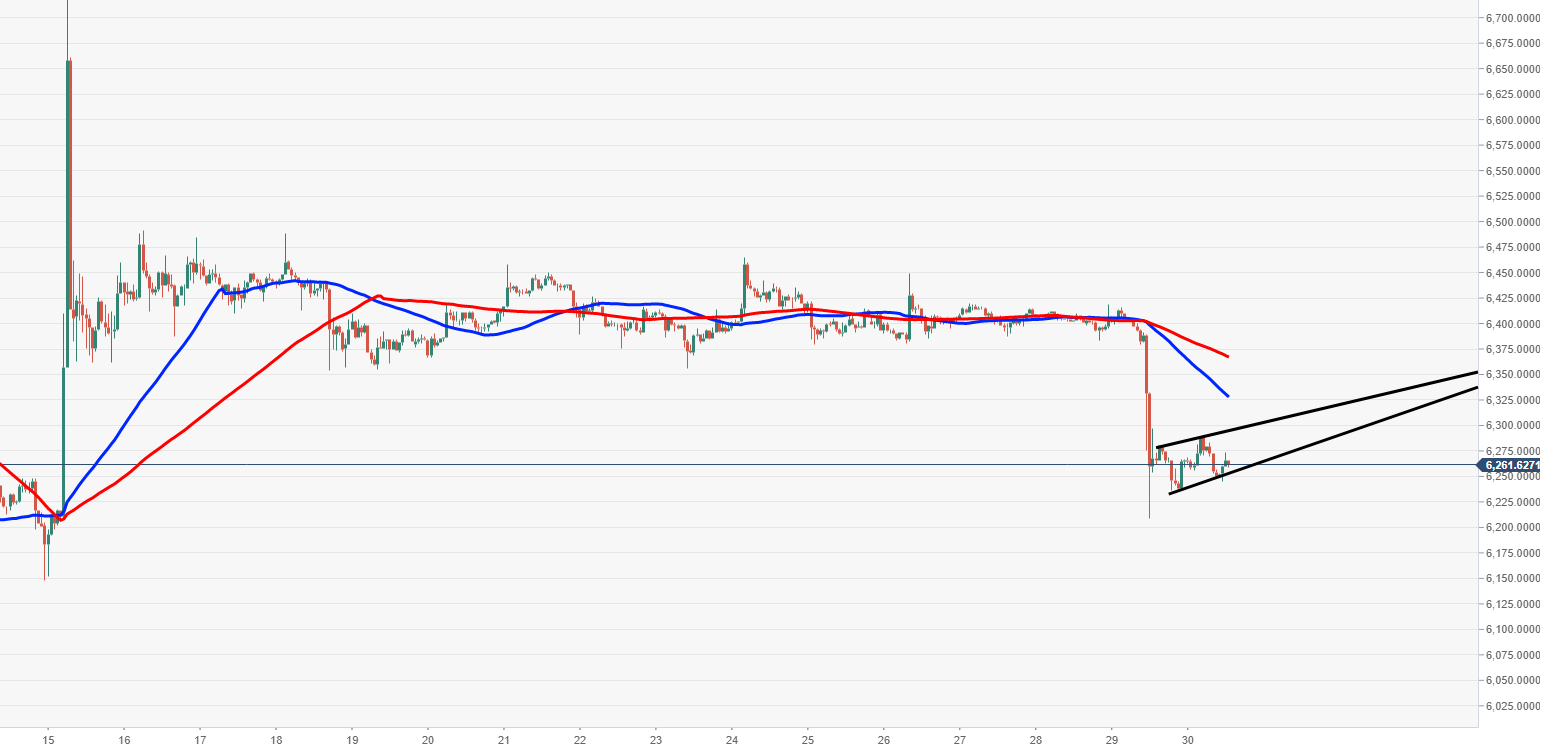
Spot rate: 6260.32
Relative change: -0.10%
High: 6415.57
Low: 6208.53
Trend: Bearish
Support 1: 6253.00, lower trend line of rising wedge.
Support 2: 6208.95, 29 October low.
Support 3: 6148.42, 14 October low & demand area.
Resistance: 6296.53, upper trend line of rising wedge.
Resistance: 6327.92, 50MA (60-minute).
Resistance: 6367.15, resistance(60-minute) & 100MA.
