- Bitcoin price is trading in the minor negative territory, down some 0.10% in the second half of the session.
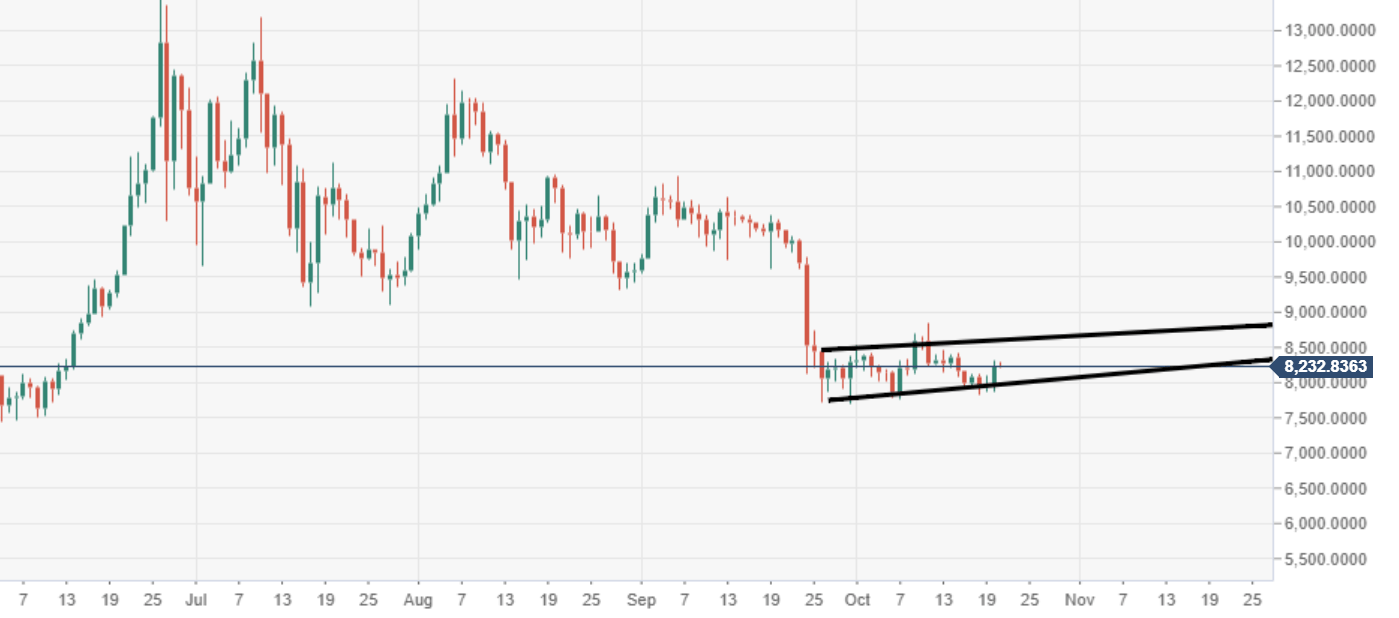
- BTC/USD is still within the confinements of a bearish flag structure via the daily chart view.
- Upside is largely capped by resistance at $8500, the upper acting trend line of the noted pattern.
BTC/USD daily chart
The price has been stuck within the bearish flag for some three weeks now, failing to demonstrate momentum to breakout.
BTC/USD 60-minute chart
Price action via the 60-minute chart view is narrowing after a decent push north, but bullish momentum may have run out of steam here.
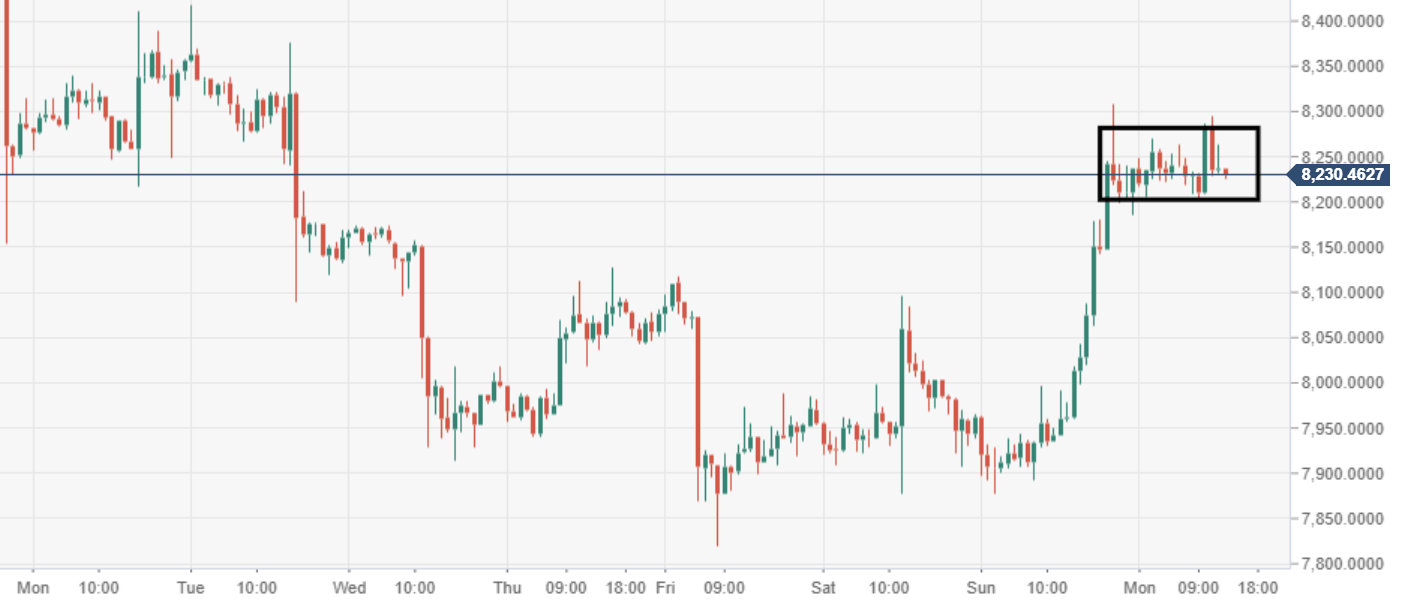
Spot rate: 8,230.72
Relative change: -0.10%
High: 8,294.74
Low: 8,201.35
