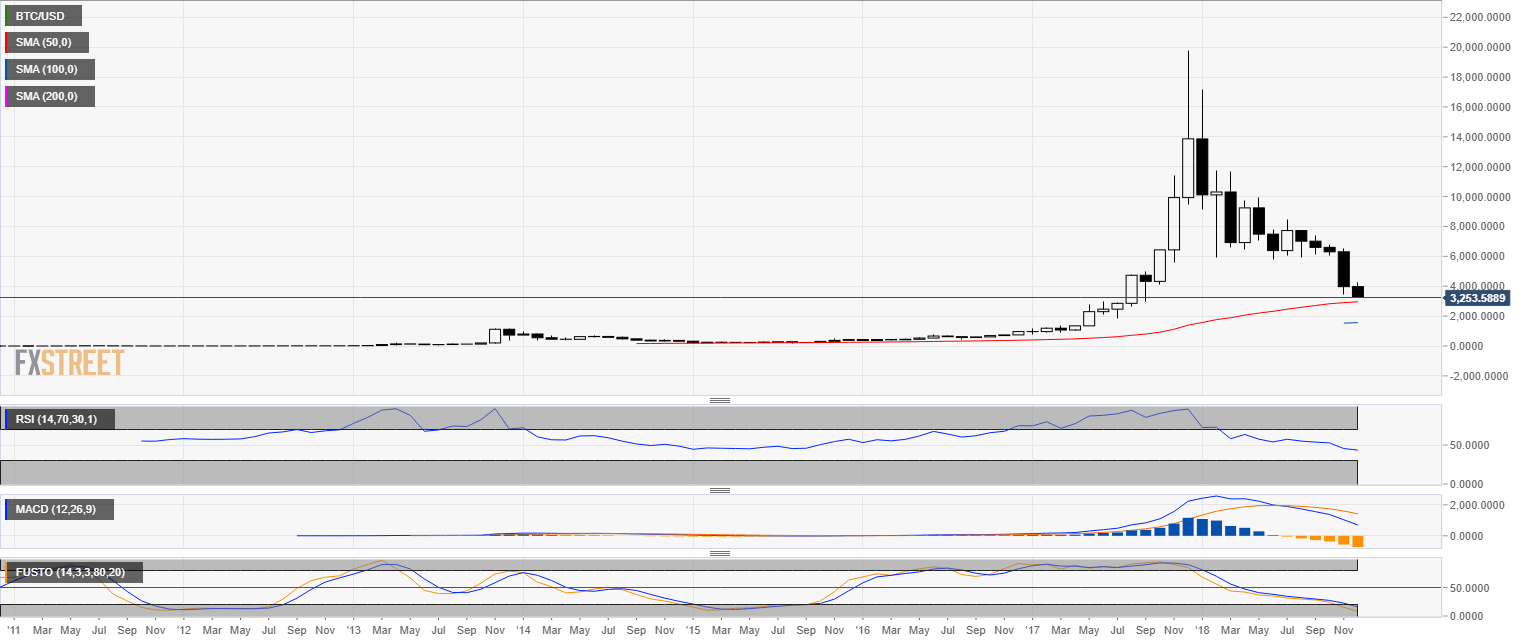
BTC/USD monthly chart
- The 2018 Bitcoin bubble continues to suffer neverending losses as a drop to 2,960.00 seems inevitable.
- To the downside, 2,330.00 followed by 1,710.00 are the main bear targets. If 1,710.00 is exceeded then 960.00 should come into play.
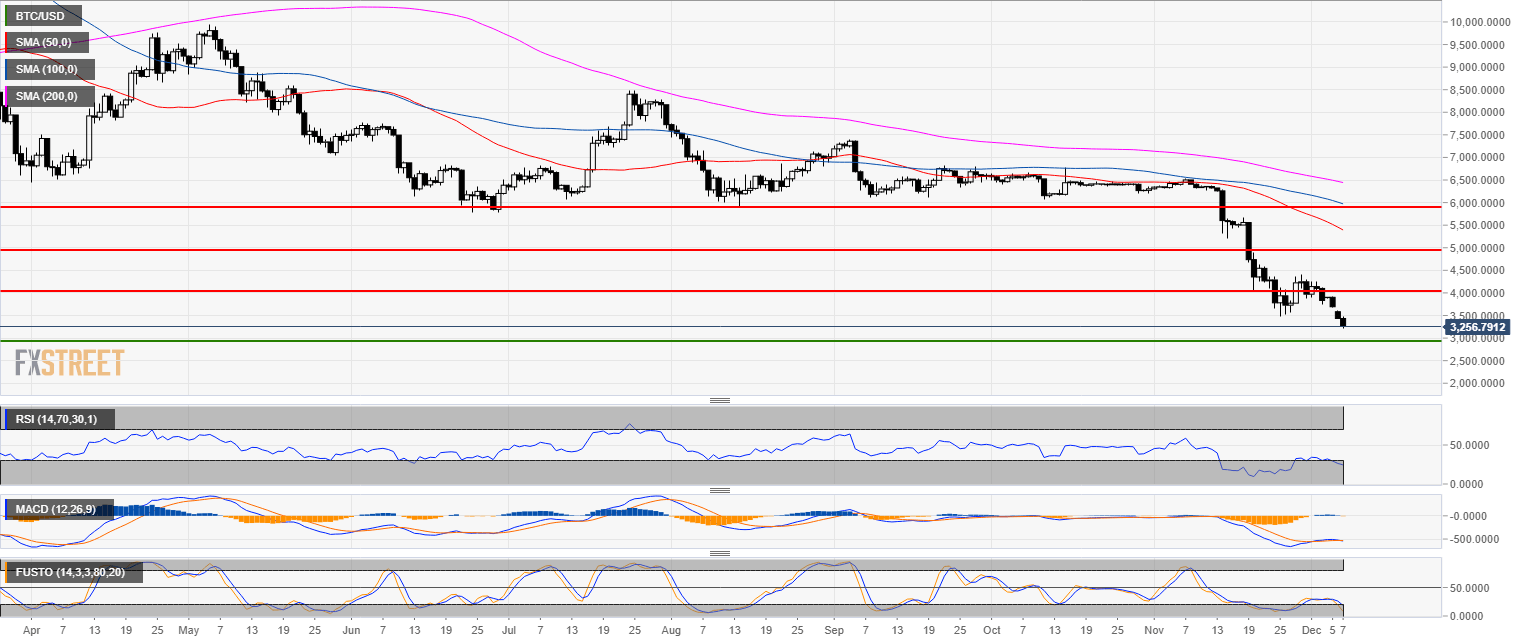
BTC/USD daily chart
- BTC/USD is trading below its 50, 100 and 200 SMA.
- To the downside, 2,960.00 should provide some short-term support. A break below the level should open the doors to 2,330.00 and 1,710.00.
- To the upside, the 4,000.00 level should act as strong resistance.
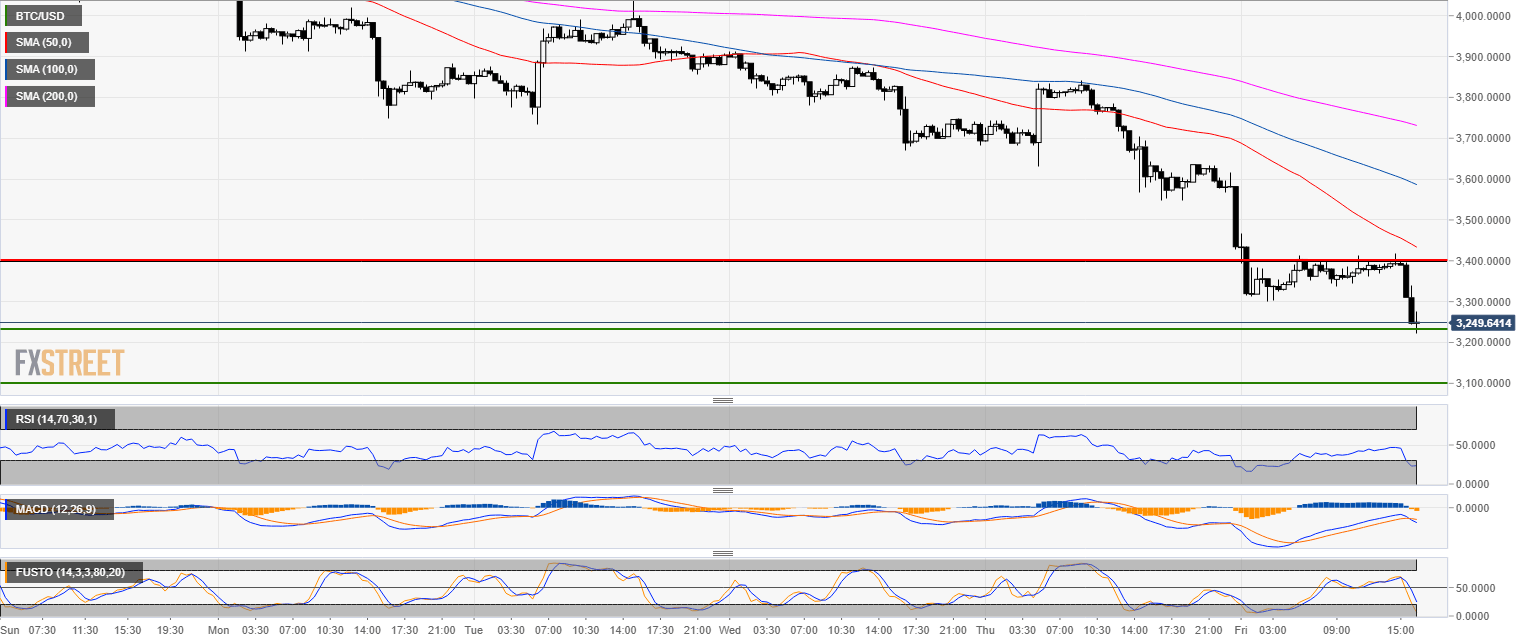
BTC/USD 30-minute chart
- The picture on smaller time-frames suggest that 3,400.00 should act as resistance.
- Looking down 3,100.00 should be the next short-term target.
Additional key levels
BTC/USD
Overview:
Today Last Price: 3257.28
Today Daily change: -1.8e+4 pips
Today Daily change %: -5.16%
Today Daily Open: 3434.41
Trends:
Previous Daily SMA20: 4281.19
Previous Daily SMA50: 5507.03
Previous Daily SMA100: 6041.63
Previous Daily SMA200: 6492.68
Levels:
Previous Daily High: 3841.6
Previous Daily Low: 3427.48
Previous Weekly High: 4404.49
Previous Weekly Low: 3466.94
Previous Monthly High: 6538.13
Previous Monthly Low: 3466.94
Previous Daily Fibonacci 38.2%: 3585.67
Previous Daily Fibonacci 61.8%: 3683.41
Previous Daily Pivot Point S1: 3294.06
Previous Daily Pivot Point S2: 3153.71
Previous Daily Pivot Point S3: 2879.95
Previous Daily Pivot Point R1: 3708.18
Previous Daily Pivot Point R2: 3981.95
Previous Daily Pivot Point R3: 4122.3
