- Bitcoin was seen down just shy of 1% on Thursday, as a softening in prices was still seen across the board.
- Chunky support for BTC/USD seen around the $7500 area, bears must breakdown to open up door to fresh selling.
BTC/USD 60-minute chart
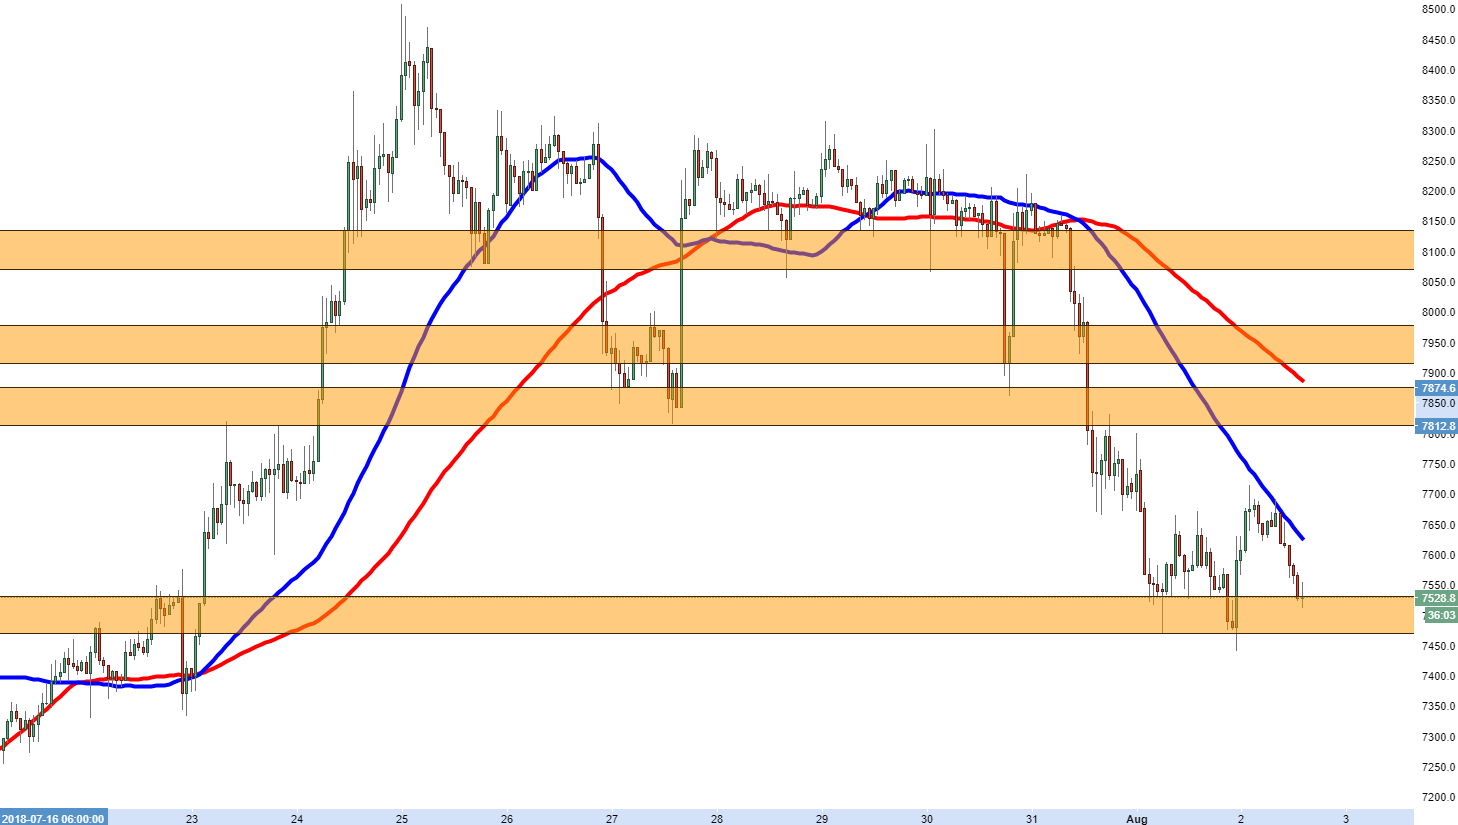
Spot rate: 7539.3
Relative change: -0.90%
High: 7713.0
Low: 7510.4
Trend: Bearish
Support 1: 7510.4, today’s (Thursday) low & demand zone.
Support 2: 7470.0, latter part of key near-term demand zone &
Support 3: 7450-400, consolidation area.
Resistance 1: 7620.7, 50MA.
Resistance 2: 7680.0, (resistance on 60-minute chart).
Resistance 3: 7815.0, supply zone entrance & 23rd July high.
