- BTC has climbed up from $10,230 on September 24 to $13,685, as of writing.
- Bitcoin’s 3-day chart has flashed the sell signal in the TD sequential indicator with a green nine candlestick.
“Bitcoin is eating the world,” claims Raoul Pal, the Founder/CEO of Real Vision Group. In a series of tweets, Pal has compared Bitcoin’s superior performance to leading asset classes such as gold, stocks, bonds, commodities, silver, etc. According to him, BTC is the most dominant and all-encompassing asset in the world. The combination of “macro, flows, technology, demography and societal strain” has made it the greatest trade and future opportunity he has ever seen.
The bulls are in full swing
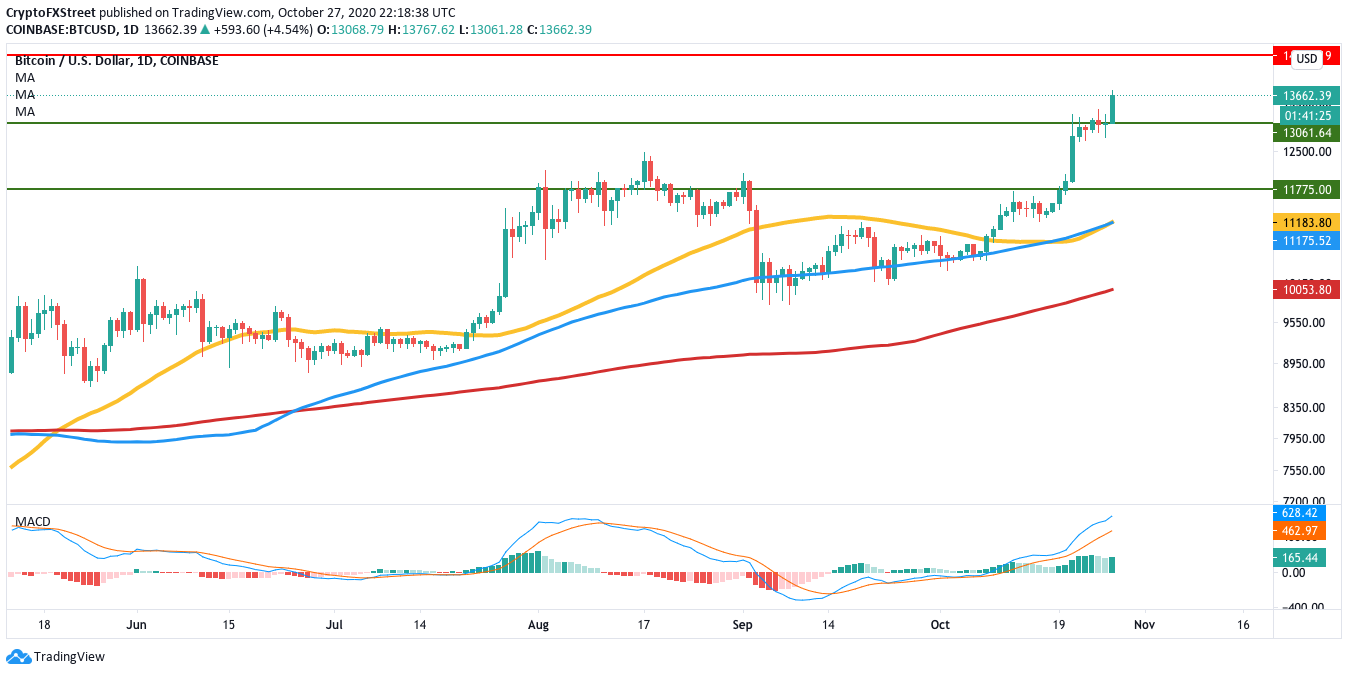
Bitcoin has climbed up from $10,230 on September 24 to $13,685, as of writing. The 50-day SMA has managed to cross back above the 100-day SMA to chart a bullish cross, while the MACD shows increasing bullish momentum. Both these indicators show that the benchmark cryptocurrency should be able to breach the $14,500 resistance barrier.
BTC/USD daily chart
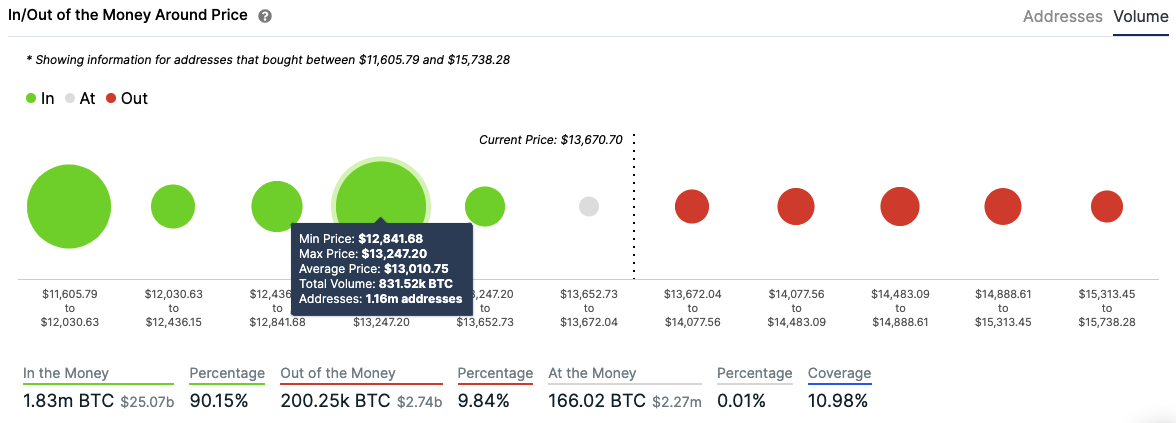
IntoTheBlock’s “In/Out of the Money Around Price” (IOMAP) is a useful metric that helps us visualize strong resistance and support walls. As per the IOMAP, there is a lack of substantial resistance walls upfront, giving BTC little friction in their move to the $14,500 line. On the downside, there are two support walls at $13,000 and $11,775, which should be healthy enough to absorb a large amount of selling pressure.
BTC IOMAP
The Flipside: Can the bears take control?
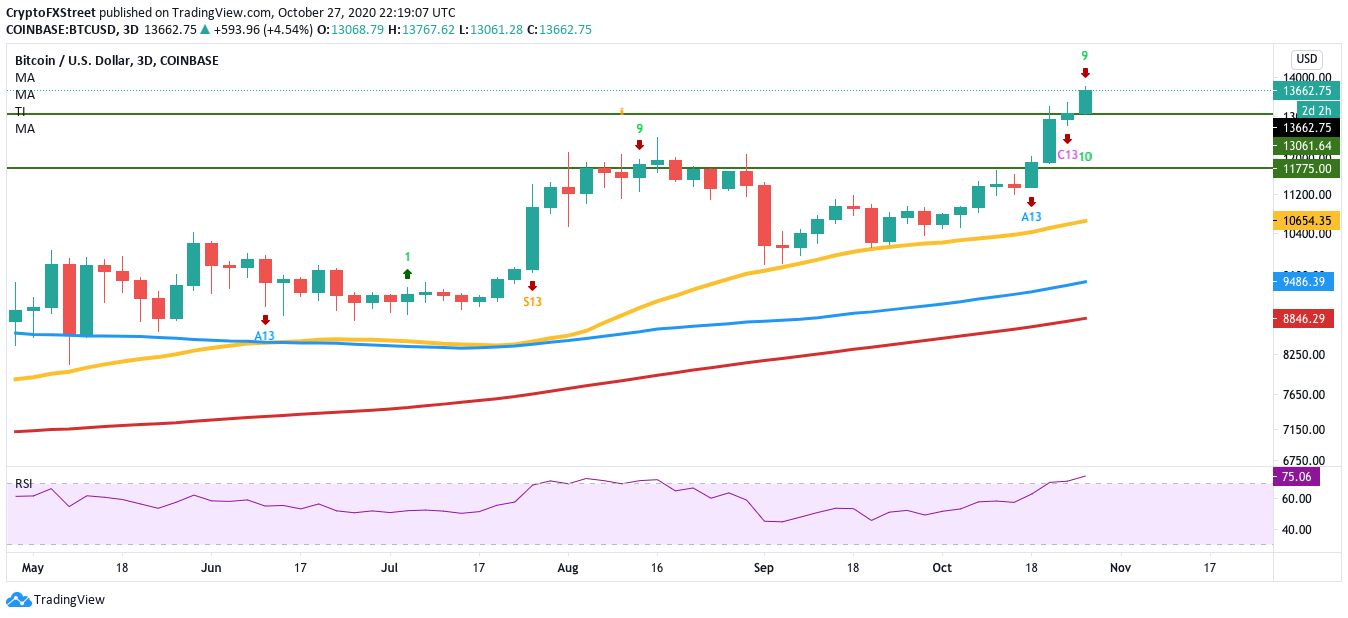
While observing the 3-day chart, a couple of indicators show us that a bearish correction may soon be around the corner. The TD sequential indicator has flashed a sell signal with a green nine candlestick. At the same time, the relative strength index (RSI) has ventured into the overbought zone. These show that a short-term negative correction may push the price down to the $13,000 support zone.
BTC 3-day chart
Plus, it looks like the whales are pocketing their profits by selling off their holdings. The number of addresses holding 1,000 to 10,000 tokens dropped from 2,135 to 2,123 between October 25 and October 27. Similarly, the number of addresses holding 10,000 to 100,000 BTC fell from 105 to 104 between October 26 to October 27. The fact that whales are selling off their holdings could have massive bearish consequences.
BTC holders distribution
%20%5B03.13.05,%2028%20Oct,%202020%5D-637394387351543001.png)
Key price levels to watch
The bulls will aim to cross the $14,500 resistance barrier. If they manage to conquer this, BTC should be able to pass the $15,000 mark.
The bears will look to push the price down to the $13,000 support level. A break below that will take the price down to $11,775.
