- Bitcoin has been sitting in a tight range for a week.
- The breakthrough is likely to be on the downside.
A failed attempted to settle above $4,000 handle discouraged BTC bulls for a while as the first largest coin spend the week in a tight range close to $3,800. Nearly all daily candles on BTC/USD chart are Doji-candles, which is a signal of extremely high uncertainty on the market and implies the continuation of the downside trend with the first aim at $3,700-$3,680 (DMA100) closely followed by $3,630 (DMA50).
From the longer-term perspective, the ultimate support is created by $3,400 strengthened by SMA200 (weekly chart).
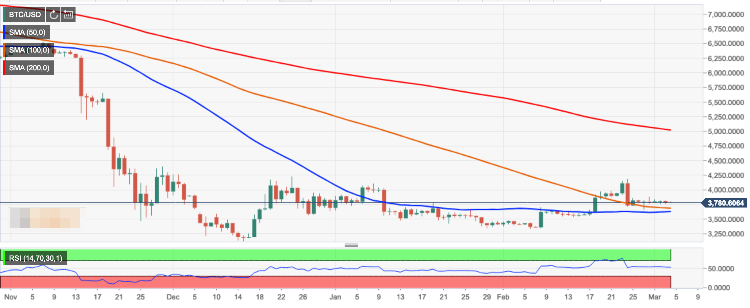
The price may retest this area before a new recovery wave. The bulls need to take the price above $3,900 congestion zone; however, their main focus is on psychological $4,000 and the recent high of $4,187. We will need to see a sustainable move above this area for the recovery to gain traction. In this case, BTC/USD may reach $5,000 quickly. This barrier is fortified by DMA200, that may keen bulls’ enthusiasm in check.
BTC/USD, 1D chart