- Bitcoin price has underperformed this week as it crashed roughly 21% between May 12 and 13.
- MoneyGram’s partnership with Coinome adds a tailwind to Bitcoin adoption.
- The BTC mining industry seems to have come into the spotlight.
Bitcoin price underwent a severe nosedive as Elon Musk revealed Tesla’s decision on accepting payment in BTC. This development was the major highlight of the week, with the recent mining difficulty adjustment coming in at a close second. As BTC price hangs in the balance, most on-chain metrics hint that another crash could be heading the pioneer cryptocurrency’s way.
Tesla pulls the plug, but demand continues rising
Tesla CEO Elon Musk was the bearer of bad news this week as he tweeted on May 13 that the electric car maker will no longer accept payment in BTC. Market participants reacted acutely to this revelation and went into a selling spree, tanking Bitcoin price by a whopping 16% in under 24 hours.
To make matters worse, reports of Binance, one of the world’s largest cryptocurrency exchanges, being investigated by the US Justice Department and Internal Revenue Service, pushed Bitcoin price off the ledge by another 5.8%.
The only solace amid dire times like these is the upward trajectory of the flagship cryptocurrency’s adoption. MoneyGram revealed their partnership with crypto exchange, Coinome. The collaboration will help the money transfer company accept BTC and debut its cash-to-Bitcoin trades at 12,000 locations worldwide.
On a similar note, Peter Thiel’s data analytics company, Palantir Technologies, announced that it will accept payments in BTC during its Q1 earnings call on Tuesday. Like MicroStrategy, Square, Tesla, the firm is also considering adding BTC to its balance sheet.
Bitcoin’s rising popularity has attracted interested parties to explore the mining industry and its profitability as well.
The Bitcoin network’s mining difficulty saw a 21.35% increase on Thursday, the biggest increase since 2014.
‘Difficulty’ is a metric used to measure the competition for earning block rewards. It is a method employed by the BTC network to keep the time required to mine a block at 10 minutes. New adjustments take around 2016 blocks or roughly 14 days.
Therefore, the recent uptick reflects that the mining industry is becoming more palpable as an investment opportunity.
Renaissance Technologies, an American hedge fund known for outperforming a majority of the investment companies, has ventured into the Bitcoin mining industry. The investment firm has amassed $140 million worth of stock positions in popular mining companies like Riot, Marathon, and Canaan in the first quarter of 2021.
This development adds credence to the pioneer cryptocurrency and its burgeoning ecosystem that the traditional finance and the plethora of players in it are comfortable with BTC.
Bitcoin price heads south
While the fundamentals grow stronger over time, Bitcoin price is going through a period of high volatility. The flagship cryptocurrency recently slid nearly 21% in less than 48 hours to then rebound by 10% from the local bottom of $47,000.
If upward pressure remains, BTC might tag the 100-day simple moving average at $53,400.
Interestingly the daily supply zone that stretches from $53,400 to $57,120 coincides with the 100 and 50-day SMAs, respectively. This area has prevented a retest of the all-time highs at $64,895.22 more than twice over the past two weeks. Therefore, only a decisive close above $57,120 will confirm the start of a new uptrend toward the next resistance zone that extends from $61,200 to $63,855.
Breaching both of these resistance levels will open up the path for retesting all-time highs.
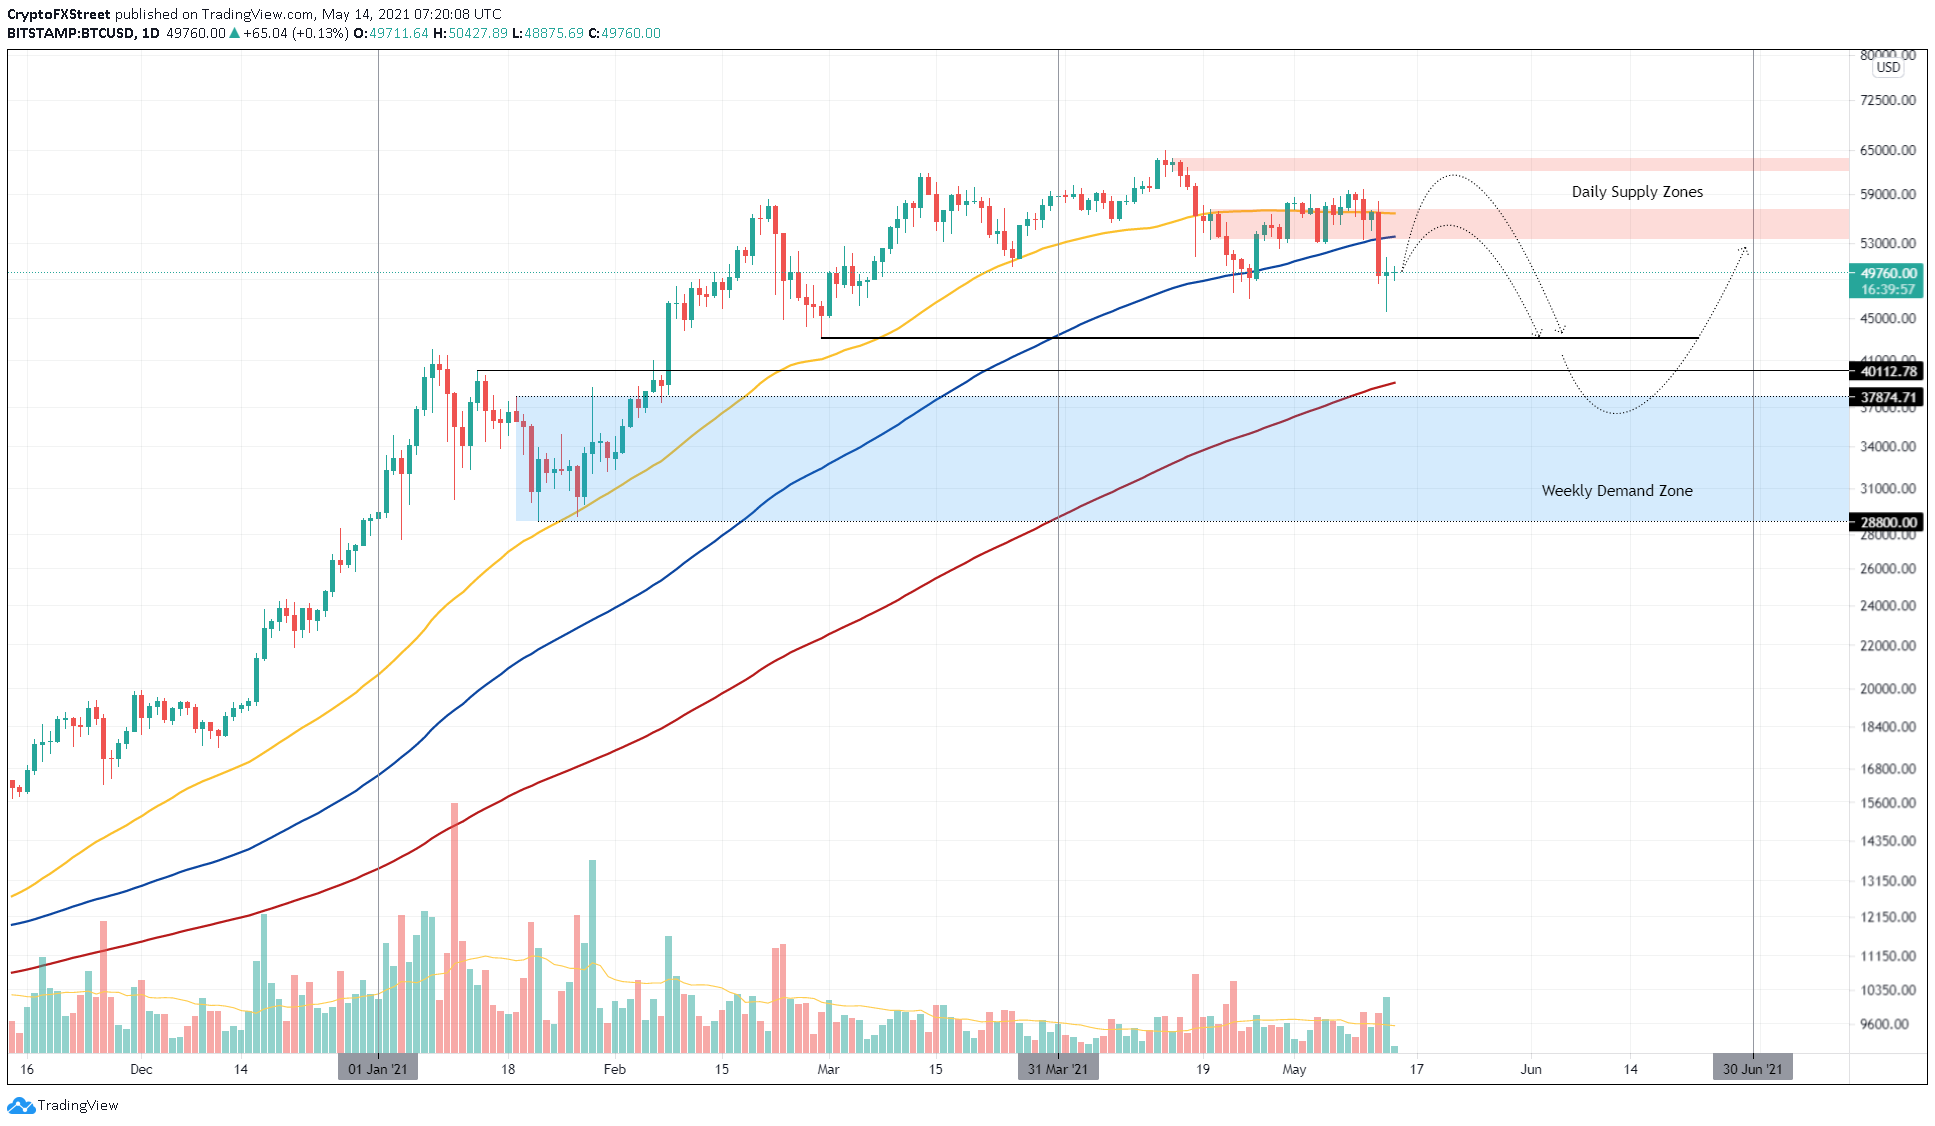
BTC/USD 1-day chart
Supporting the optimistic narrative is the Miners Position Index (MPI). CryptoQuant defines this metric as the “ratio of BTC leaving all miners wallets to its 1-year moving average.”
This on-chain indicator is used to gauge the selling pressure from miners. Typically, values above two indicate that miners are offloading their holdings and can negatively impact Bitcoin price.
MPI currently shows a whopping downswing of 105% since January 29.
The slump from 8.82 to -0.25 suggests that these market participants are holding/accumulating BTC and are less inclined to sell. Moreover, MPI has stayed in the negative territory since March 6, with brief but minor spikes above the zero level.
When considering that miners who are the primary source of Bitcoin selling pressure have taken a u-turn, the bullish thesis explained above seems possible.
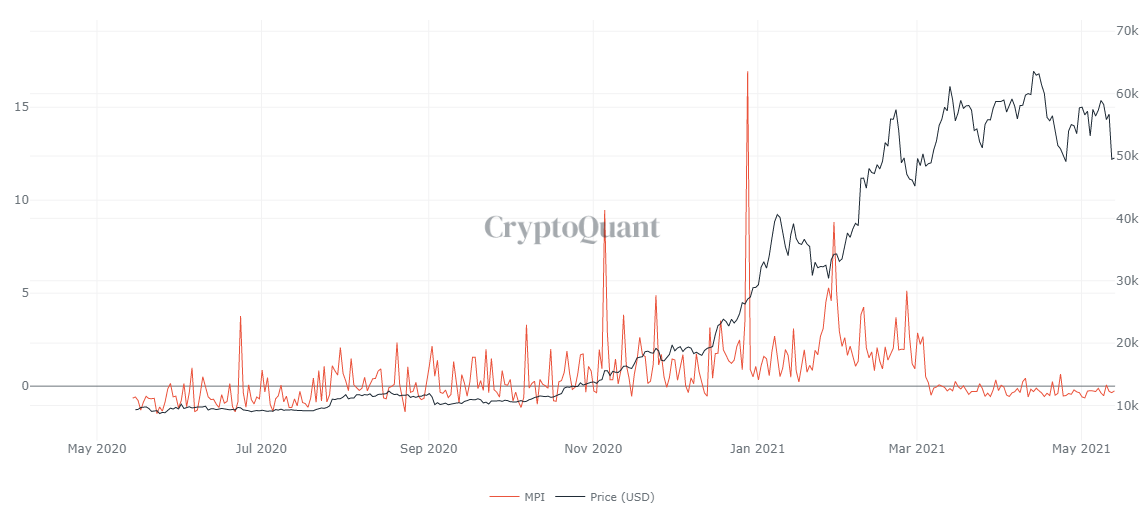
BTC MPI chart
As bullish as Bitcoin price seems, the inability of the buyers to push it above the supply zone ranging from $53,400 to $57,120 will lead to a retest of the recent swing low at $45,700. A potential increase in selling pressure at this point might cause Bitcoin price to head to a stable support level at $40,112.
The Bitcoin supply on exchanges, which accounts for the number of BTC tokens held by these entities, reveals that sell orders may be piling up.
Roughly 600,000 BTC have been transferred to known exchange wallets over the past two weeks, representing a 3% increase within such a short period.
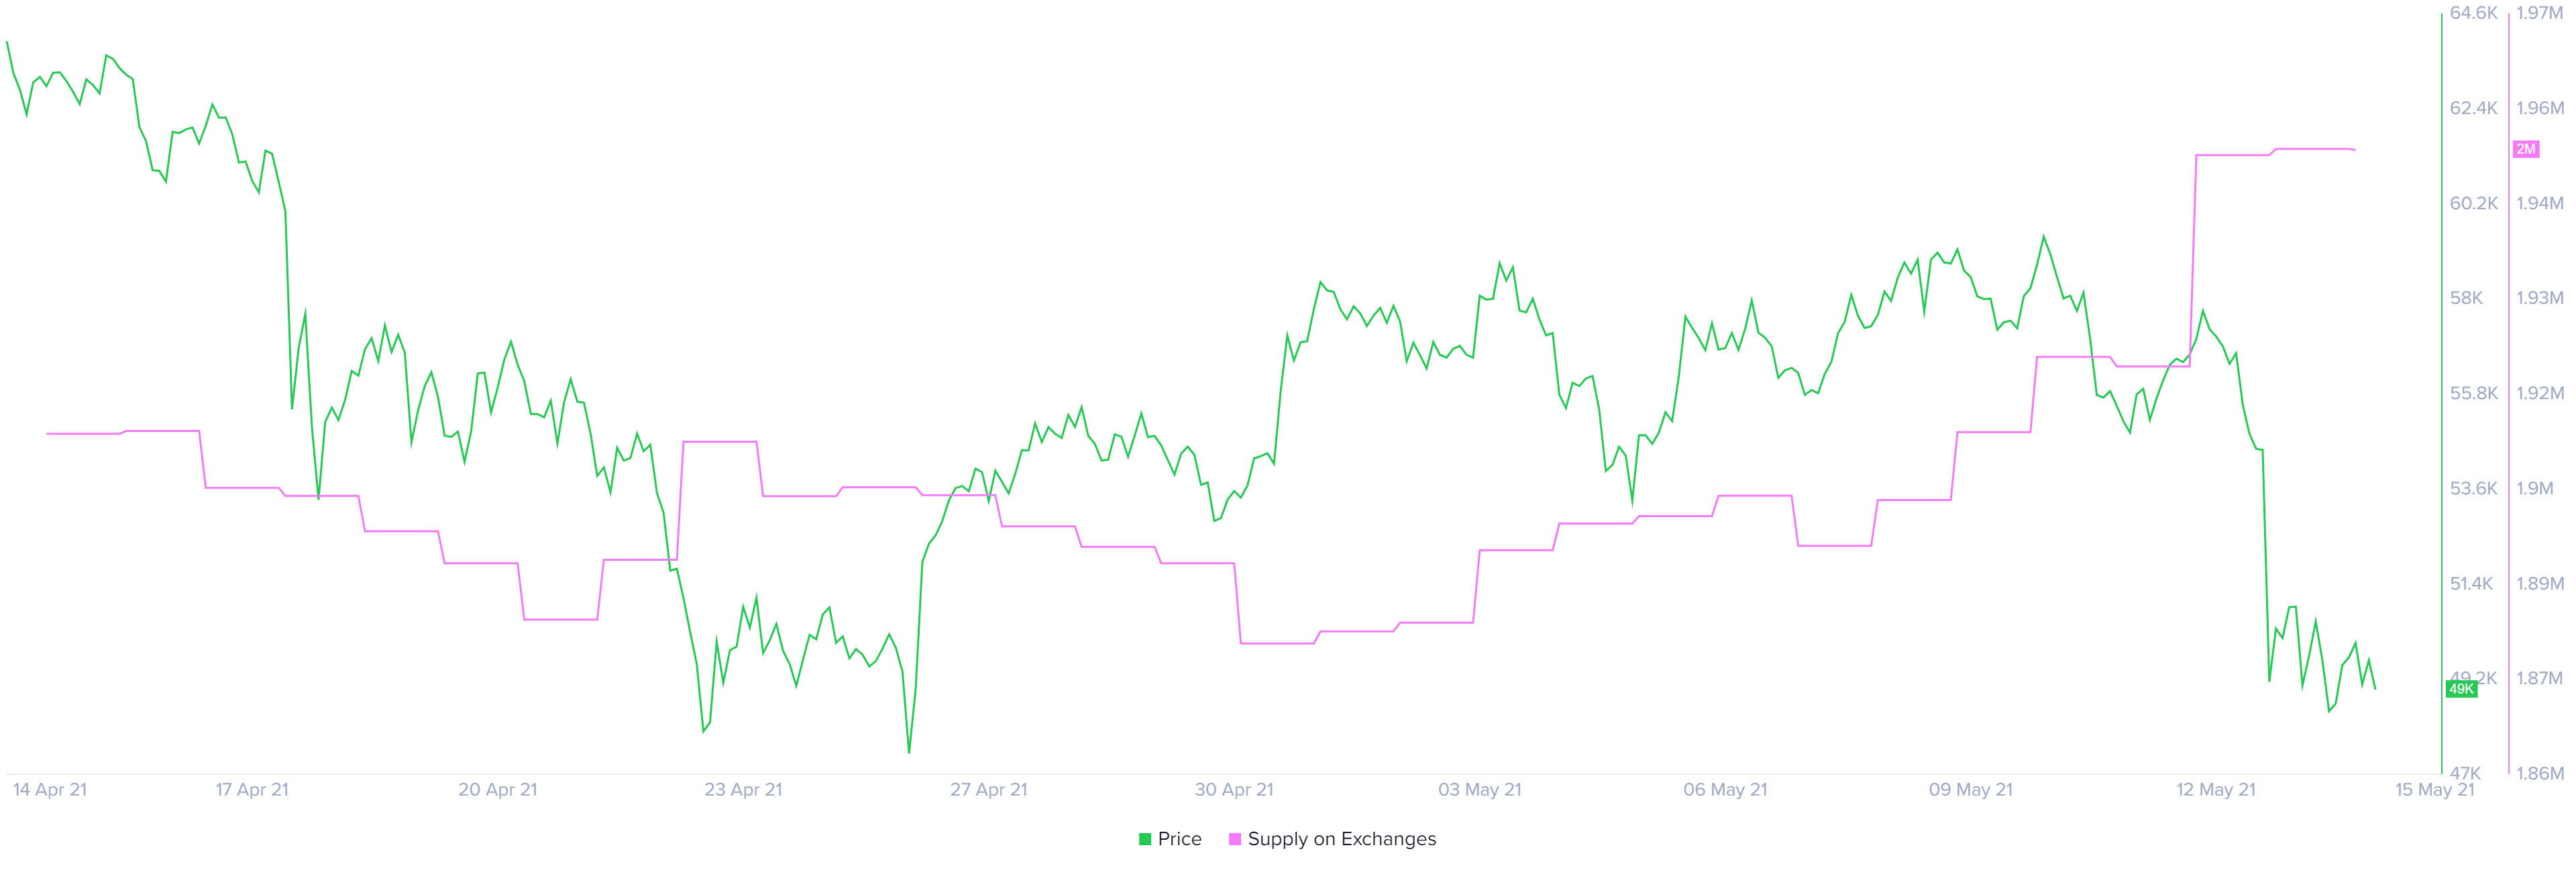
BTC supply on exchanges chart
Based on the 365-day Market Value to Realized Value (MVRV) model, it does seem like investors are more inclined to sell at the current price levels.
This fundamental index is used to measure the profit/loss of those addresses that acquired BTC over the past year. Based on the current reading, these investors are up 28.77% in their investment.
Further weakness in Bitcoin price could encourage these market participants to book profits, which coincides with the recent increase in the BTC supply on exchanges.
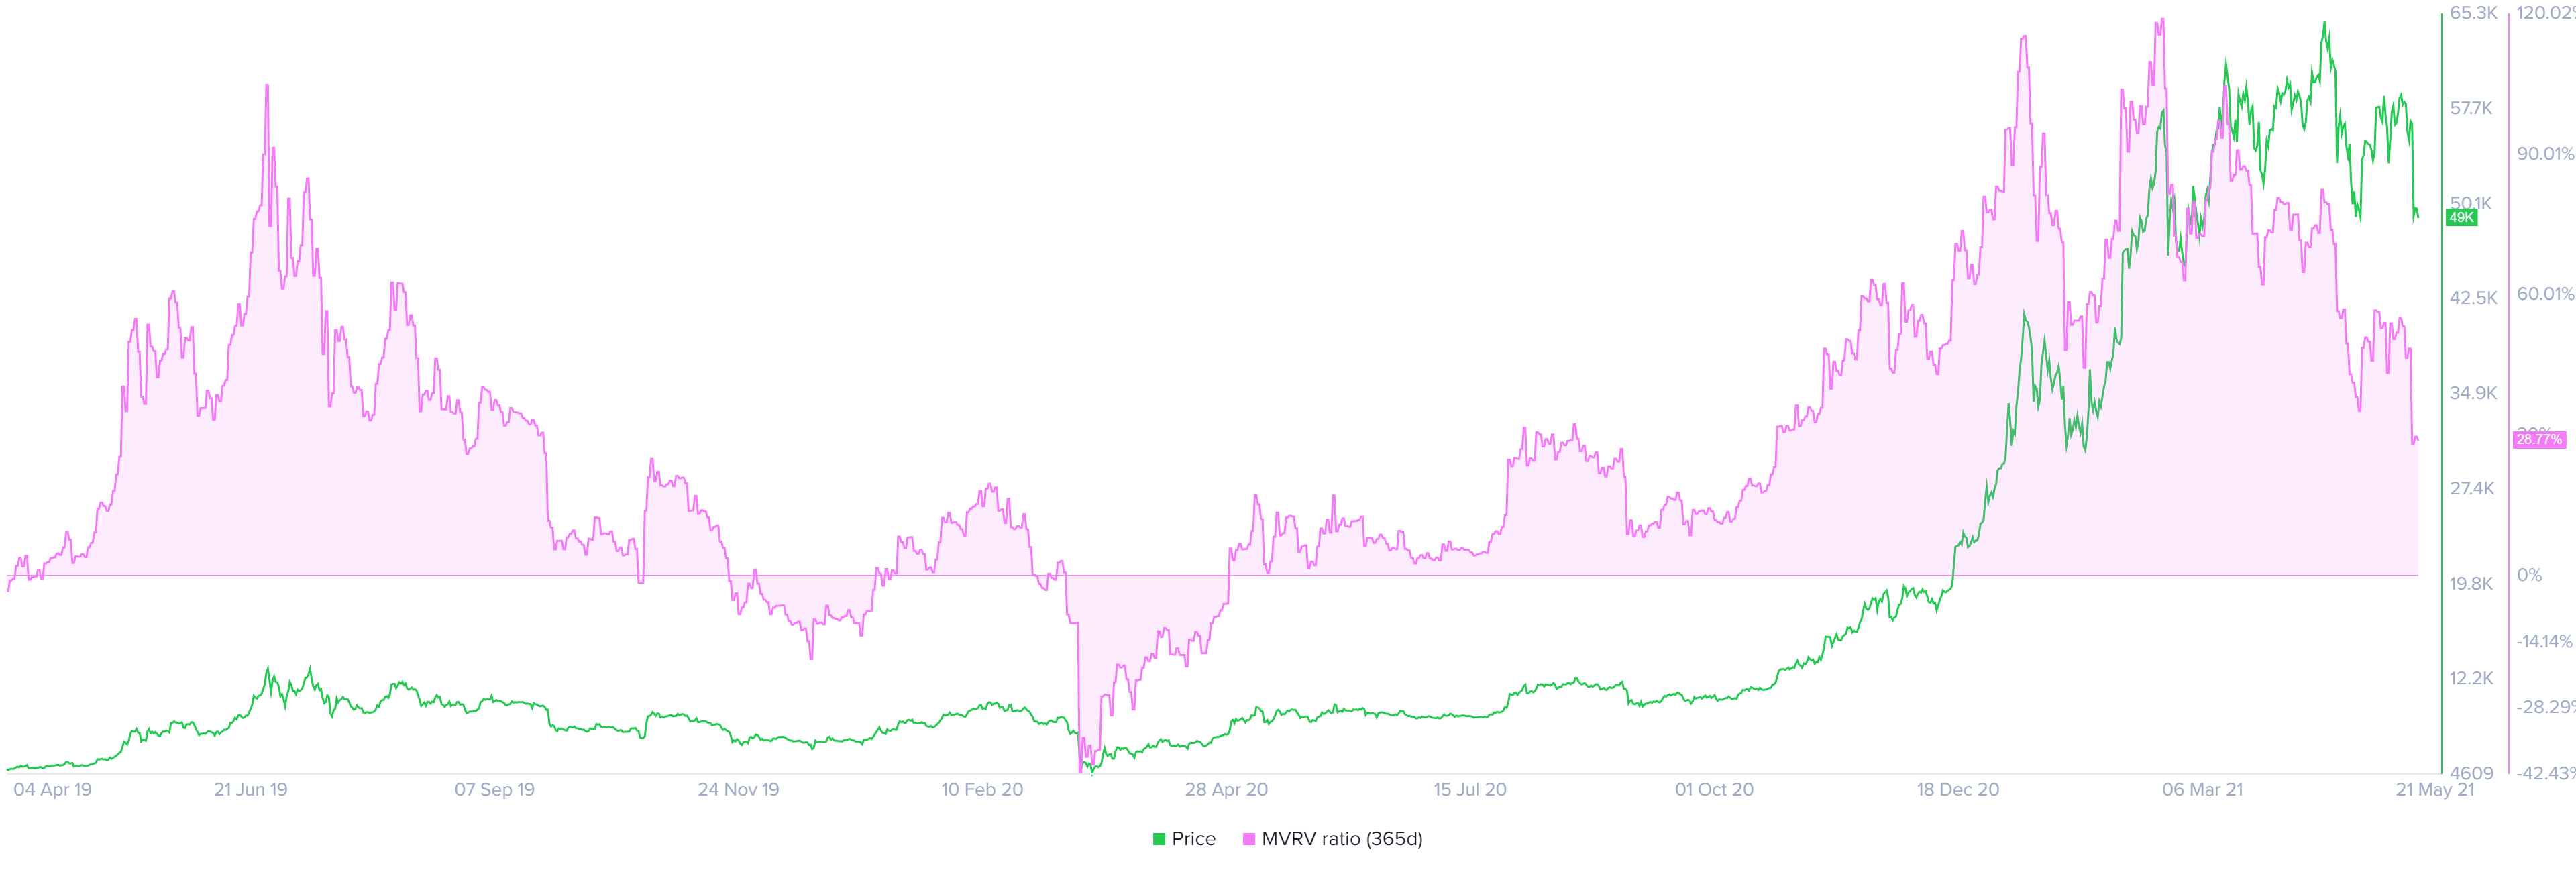
BTC 365-day MVRV chart
Although the bearish on-chain indicators trump the bullish, the most likely scenario that could play out is that Bitcoin price surges to $53,400 and fails to cross this supply zone. The resulting downtrend might extend to $40,112 and $37,874 in dire circumstances, which is the first opportunity that buyers have at rescuing the free-falling asset.
There is a high probability that if Bitcoin price ever comes down to this level, it will be ephemeral and will result in a quick reversal.
