- Bitcoin (BTC)’s sell-off will speed up if $8,700 is broken.
- An initial resistance awaits the bulls on approach to $8,800.
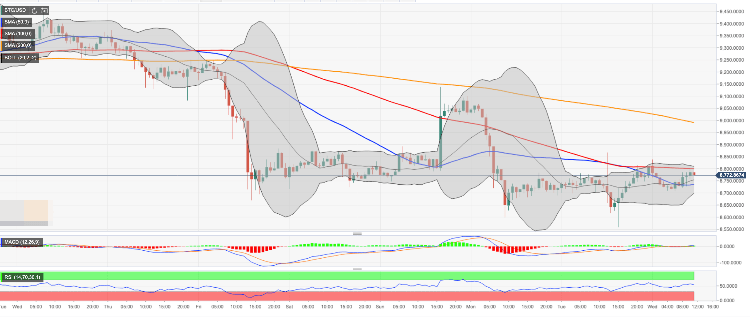
Bitcoin is locked in a tight range limited by $8,800 on the upside and $8,700 on the downside. The first digital coin has recovered from Tuesday’s low of $8,558; however, the upside momentum has faded away on approach to the resistance area created by a combination of SMA100 (Simple Moving Average) and the upper line of the Bollinger Band on 1-hour timeframe. We will need to see a sustainable move above this handle for the upside to gain traction with the next focus on $9,000. SMA200 (Simple Moving Average) 1-hour might turn in into a stiff barrier for BTC bulls.
BTC/USD 1-hour chart
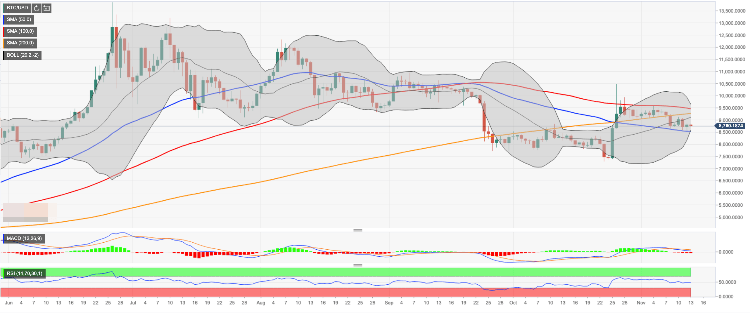
From the longer-term perspective, the first resistance comes with the middle line of the Bollinger Band at $9,100. It is followed baby SMA100 ($9,250) and SMA200 ($9,450). BTC/USD has been trading below SMA100 daily since September 14; thus, a sustainable move higher will send a strong bullish signal to the market.
On the downside, the initial support is created by the recent low at SMA50 daily at $8,550. A move below this area will take us to $8,000 and, potentially, to October 23 low at $7,300.
BTC/USD, the daily chart