Tertiary Industry Activity and All Industries Activity are the main events this week. Here’s an outlook for the Japanese events and an updated technical analysis for USD/JPY.
Last week Japan’s core machinery orders unexpectedly fell for a third month in November since companies halted expenditure following an end to government subsidies. However after a recent upturn in output, economists predict business spending will accelerate this year side by side with rising exports.
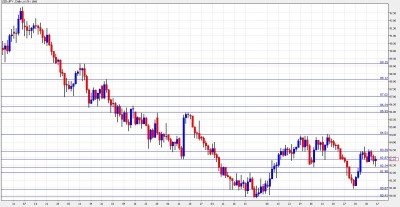
USD/JPY daily chart with support and resistance lines marked. Click to enlarge:

Let’s start:
- Household Confidence: Monday 5:00. Japan’s Household Confidence Survey index fell to 40.4 in November from 40.9 in October. This is the fifth consecutive monthly drop raising renewed concerns about job security and wage growth. A rise to 41.7 is predicted now.
- Revised Industrial Production: Tuesday 4:30. Japanese industrial production fell 2.0% in October following 1.8% drop in September marking the fifth consecutive monthly decline. Industrial production decreased due to lower demand for passenger cars and electronic parts and devices. The weakening in production caused Automakers to recalculate production for the next few months after the government ended its subsidy program in September. A rise of 1.0% is predicted now.
- Tertiary Industry Activity: Tuesday, 23:50. Japan’s tertiary activity index gained 0.5% in October, following 0.8% drop in September. The recent increase in private consumption is expected to weaken in the next months, weighing on retail trade and labor market will battle weak domestic demand and slowing global recovery. A continued rise of 0.6% is predicted now.
- All Industries Activity: Thursday, 23:50. The All Industry Activity Index fell by 0.2% in October 2010 followed a 0.8% drop in September. A rise of 0.2% is expected this time.
All times are GMT.
USD/JPY Technical Analysis
Dollar/yen was very choppy throughout the week, bouncing off the 83.40 level (discussed last week), before falling and finding a cushion above 82.34. It finally closed at 82.87.
Looking up, 83.40 is a strong line of resistance. It worked as such in the past week, and worked in both ways in recent months. Above, 84.50 is the highest level since October.
It”s then followed by 85.93, the highest level the pair reached after the big intervention in September. Above, 86.34 and 87.02 were support lines on the way down, and now work as minor resistance.
Strong resistance is found at 88.12, which worked in both direction last summer, and then by 89.15 which capped USD/JPY at that same period.
Looking down, 82.34 proved to be strong support once again. It also was a swing low in December. Below, 82 is a minor line now, after working as resistance in October.
80.87 is a tough line – it worked as support during October and also sent the pair back up recently. It’s followed by 80.40, the lowest close ever and by 79.75, the lowest intra-day level, reached back in 1995.
I remain bullish on USD/JPY.
The Japanese yen has no reason to rise, and as the US economy picks up, I believe that USD/JPY will rise with it. This pair will continue being choppy, as discussed in the 2011 forex outlook.
Further reading:
- For a broad view of all the week’s major events worldwide, read the USD outlook.
- For EUR/USD, check out the Euro/Dollar forecast.
- For GBP/USD (cable), look into the British Pound forecast.
- For the Australian dollar (Aussie), check out the AUD to USD forecast.
- For the New Zealand dollar (kiwi), read the NZD forecast.