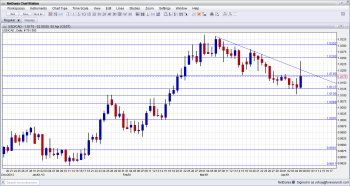
USD/CAD traded in wider range than normal, falling to fresh monthly lows and then leaping to highs. Housing data is the major release this week. Here is an outlook on the major market-movers and an updated technical analysis for USD/CAD.
Last week, disappointing Canadian employment data was released showing Canada lost 54.5K jobs in March drove unemployment rate to 7.2% from 7.0% in February. The sharp drop eliminated the big gain of 50,700 jobs in the previous month, indicating the sluggish start of 2013 continues. Will the job market improve in the coming months?
Updates: The BOC released its Business Outlook Survey. The report was not optimistic, finding that Canadian businesses expect weaker hiring and plan to lower their spending and investment due to the weak economy. Housing Starts came improved slightly to 184 thousand, beating the estimate of 176 thousand. Building Permits, this week’s key release was a major disappointment. The indicator gained 1.7% for a second straight month, but was way off the estimate of 3.7%. The Canadian dollar has improved, as USD/CAD was trading at 1.0150.
USD/CAD daily chart with support and resistance lines on it. Click to enlarge:
- BOC Business Outlook Survey: Monday, 15:30. The new BoC Business Outlook released on January, indicated an improvement in companies’ sentiment regarding the economic outlook. 16% of respondents forecasted annual sales growth in the coming year. Inflation is not a concern for the BOC, where the CPI is expected to remain contained between 1%-2% and credit conditions have also eased.
- Housing Starts: Tuesday, 13:15. Canadian housing starts rebounded in February to an annualized rate of 180,719 from158,998 in January, amid an increase in multi-family construction in Ontario and Quebec. Nevertheless, the Canadian housing market is continuing to moderate. A slight decline to 176,000 is expected this time.
- Building Permits Tuesday, 13:30. The value of Canadian building permits increased less-than-expected in January, up 1.7% after posting -10.4% reading, the biggest two-month fall in 24 years. The increase was lower than the 5.4% rise expected by analysts. The value of residential building permits increased by 17.6% in January over December while non-residential permits dropped by 19.2%. Another rise of 5.3% is expected.
- NHPI: Thursday, 13:30. Prices of new homes in Canada edged up 0.1% in January after a 0.2% increase in December. The reading was in line with market expectations. On a yearly base, growth moderated to 2.2%. Overall, prices rose in nine cities, fell in five and were flat in seven in the month. Another increase of 0.3% is anticipated.
* All times are GMT.
USD/CAD Technical Analysis
Dollar/CAD began the week trading lower, falling to support at 1.0125, which was tested again and again. After dipping to lower ground, the pair couldn’t break below 1.01 (mentioned last week) and it then made a jump to 1.0238 before retreating and closing at 1.0175.
Technical lines, from top to bottom:
1.0523 was a peak back in November 2011 and is minor resistance. 1.0446 was the peak that the pair recorded in June 2012 and is a key line on the upside.
1.0340 was the peak during March 2013 and its position strengthens at the moment. Consequent rises failed to reach this line, and this could be a bearish sign. The round number of 1.03 was resistance at the beginning of the year and now returns to this role. It worked perfectly well during June – over and over again, until finally being run through.
1.0250 was a peak before the pair moved below parity a long time ago, and worked as support quite well in March 2013. It is weakening now. 1.0180 provided support for the pair during March, and late switched to resistance. It is now a pivotal line.
1.0125 gave its support to the pair during April 2013 and remains important despite the temporary break. 1.01, was a trough back in July, and switched to resistance afterwards. The line proved its strength several times in 2013.
1.0066 was key support before parity. It’s strength during July 2012 was clearly seen and it gave a fight before surrendering. It has a stronger role after capping the pair during November 2012, but has begun weakening. The very round number of USD/CAD parity is a clear line of course, and the battle was very clear to see at the beginning of August 2012 and also in 2013. It is a clear separator.
0.9950 provided some support for the pair during November and worked as resistance earlier. 0.9910 remains the chart after serving as a bottom border for the pair in November 2012. It already managed to work as weak resistance in December 2012.
0.9880 showed that it is a clear separator in October 2012. It also had a role in the past. This line switches roles once again.
I am neutral on USD/CAD.
The very disappointing jobs report in Canada erased the gains of the previous report and cast a shadow over the loonie’s strength. However, also in the US, the Non-Farm Payrolls gain was very disappointing, so the chances of QE are reduced now. All in all, the pair could maintain its current balance.
Further reading:
- For a broad view of all the week’s major events worldwide, read the USD outlook.
- For EUR/USD, check out the Euro to Dollar forecast.
- For the Japanese yen, read the USD/JPY forecast.
- For GBP/USD (cable), look into the British Pound forecast.
- For the Australian dollar (Aussie), check out the AUD to USD forecast.
- USD/CAD (loonie), check out the Canadian dollar
