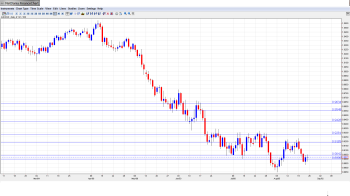
AUD/USD reversed direction last week, as the pair dropped about 150 points. AUD/USD ended the week slightly above the 0.90 line, at 0.9021. This week’s market-mover is Private Capital Expenditure. Here is an outlook of the events and an updated technical analysis for AUD/USD.
Australian New Motor Sales posted a sharp decline and the RBA minutes indicated that the Australian central bank wants to see a weak Australian dollar. The US dollar was broadly stronger as the FOMC minutes indicated that QE tapering is only a question of time.
[do action=”autoupdate” tag=”AUDUSDUpdate”/]AUD/USD graph with support and resistance lines on it. Click to enlarge:
- Construction Work Done: Wednesday, 1:30. This indicator is an important gauge of the construction industry, and its release every quarter magnifies its impact. The indicator has not looked sharp, posting three declines in the past four quarters. The markets are expecting a turnaround in Q2, with an estimate of a 1.1% gain.
- HIA New Home Sales: Thursday, Tentative. New Home Sales has looked strong in recent releases, and racked up a 3.4% gain in the previous reading. The markets will be hoping for another strong performance in the upcoming release.
- Private Capital Expenditure: Thursday, 1:30. This indicator is the key event of the week. Private Capital Expenditure measures the change in new capital spending by private businesses, which is important for economic growth. The indicator has posted two consecutive declines, but the markets are expecting a slight gain in August, with an estimate of 0.2%.
- Private Sector Credit: Friday, 1:30. Private Sector Credit is an important gauge of consumer borrowing. An increase in credit translates into more consumer spending, a critical component of economic activity. The indicator has been quite steady and gained 0.4% in July. An identical gain is expected in the upcoming release.
AUD/USD Technical Analysis
AUD/USD started the week at 0.9197. The pair climbed to a high of 0.9233, but then dropped sharply, touching a low of 0.8932. AUD/USD bounced back above the 0.90 line and closed the week at 0.9021, as the support level of 0.9000 (discussed last week) remained intact.
Live chart of AUD/USD: [do action=”tradingviews” pair=”AUDUSD” interval=”60″/]
Technical lines from top to bottom:
We begin with resistance at 0.9634. This line last saw action in mid-June, when the pair started a downward slide in which it dropped below the 0.92 line.
0.9549 is the next line of resistance. This is followed by 0.9428. This line had played a support role since late 2011, but was breached in June and has provided strong resistance since then.
0.9283 saw a lot of action in the months of June and July, alternating between resistance and support roles. It has some breathing room as a resistance line as AUD/USD trades at lower levels.
0.9180 has reverted to a resistance role with the Australian dollar sustaining strong losses last week.
0.9041 has been busy in August. This week was no exception and the line starts the week as a weak resistance line. It could be tested if the Aussie shows any upward movement.
The round number of 90 is next. This psychologically important level has provided support since September 2010, but has seen some action over the past few weeks. It was breached last week, but remained in place as a weak support level at the end of the week.
0.8893 has been a steady support line since August 2010, as the Australian dollar put together a strong rally which saw it climb above the 1.10 line.
0.8747 has remained in place since July 2010.
The final support line for now is 0.8568. This line has held firm since July 2010, when the Australian dollar started a rally which saw it climb to the 1.10 line.
I am bearish on AUD/USD.
AUD/USD had a bad week and the downward trend could continue. Many investors will be jittery as the RBA minutes indicated that it wants to see the Australian dollar remain at low levels to help the economy. Meanwhile, the US Federal Reserve could taper QE as early as September and action on this front by the Fed is bullish for the US dollar.
The Aussie sometimes moves in tandem with gold. You can trade binary options on gold using this technical analysis.
Further reading:
- For a broad view of all the week’s major events worldwide, read the USD outlook.
- For EUR/USD, check out the Euro to Dollar forecast.
- For the Japanese yen, read the USD/JPY forecast.
- For GBP/USD (cable), look into the British Pound forecast.
- For USD/CAD (loonie), check out the Canadian dollar forecast.

