The New Zealand dollar made a significant attempt to reach the multi-decade high. Can it break it this week? Is 0.90 the next target? The big event of the week is the quarterly CPI report. Here is an analysis of fundamentals and an updated technical analysis for NZD/USD.
Rating agency Fitch upgraded the outlook for New Zealand from neutral to positive and this certainly gave a boost to the kiwi, outweighing a significant drop in the NZIER Business Confidence. The kiwi also ignored some positive signs in the US and NZD/USD came less than 10 pips away from the multi-decade high of 0.8842.
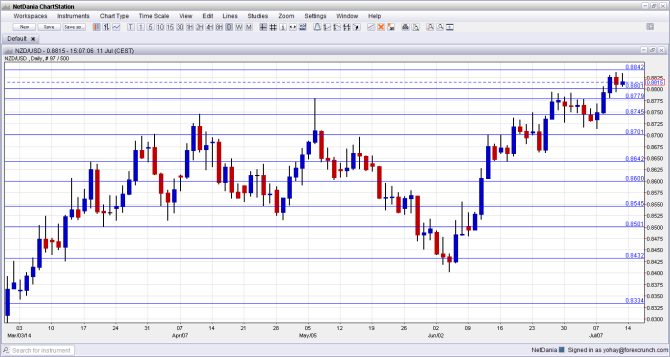
[do action=”autoupdate” tag=”NZDUSDUpdate”/]NZD/USD daily chart with support and resistance lines on it. Click to enlarge:
- CPI: Tuesday, 22:45. New Zealand publishes the key inflation number only once per quarter, making the impact on markets quite strong. The consumer price index is key for the RBNZ, which is currently on course to raise the rates once again. After a rise of 0.3% in Q2, a larger q/q rise of 0.5% is expected. Year over year, prices rose 1.5% in Q1, and it can tick higher in Q2.
- REINZ HPI: Exact publication time unknown at the time of writing. This house price indicator surprised in May with a drop of 1.2%, cutting short 3 months of gains. A return to a modest gain is likely now in this indicator.
* All times are GMT.
NZD/USD Technical Analysis
Kiwi/dollar started the week with a move higher, eventually recapturing the 0.8780 level (mentioned last week). It then continued higher and was within striking distance of the multi-year highs of 0.8842.
Live chart of NZD/USD:
[do action=”tradingviews” pair=”NZDUSD” interval=”60″/]Technical lines, from top to bottom:
We can look beyond the multi year highs, and the clear line above is the round 0.90 line. Beyond this level, 0.92 could be eyed.
And at charted territory, 0.8840. This is the ultimate line of resistance. Above this point, only the round level of 0.90 awaits.
The May peak of 0.8780 is a very important line: the kiwi hesitated towards this line in June. The previous 2014 peak of 0.8745 is now weaker resistance after being broken.
The round number of 0.87 proved its strength during May and joins the chart as key upside resistance. The older swing high of 0.8640 worked as a pivotal line but eventually capped the pair.
It is followed by the round number of 0.86, which worked as a cushion during May 2014. The low of 0.8550 served as yet another pivotal line in the range.
I am bearish on NZD/USD
While NZD/USD may reach new multi-decade highs in the upcoming week, we can cast a doubt if this is sustainable. During Q2, the exchange rate was high, and this could push inflation lower. In addition, we have a testimony from Yellen, and she could finally acknowledge the improvement in the US economy.
More kiwi: Double Bottom Suggests More Gains For AUDNZD
Further reading:
- For a broad view of all the week’s major events worldwide, read the USD outlook.
- For EUR/USD, check out the Euro to Dollar forecast.
- For the Japanese yen, read the USD/JPY forecast.
- For GBP/USD (cable), look into the British Pound forecast.
- For the Australian dollar (Aussie), check out the AUD to USD forecast.
- For USD/CAD (loonie), check out the Canadian dollar forecast.
