The New Zealand dollar had another heavy week due to the greenback’s strength and the big trade deficit at home. The light calendar at the wake of the new month doesn’t mean a lack of action. Here is an analysis of fundamentals and an updated technical analysis for NZD/USD.
New Zealand trade balance turned negative with a first deficit after 8 positive months. And, it was larger than expected at 692 million. In the US, consumer confidence rose to a pre-recession high, but not all figures were equally positive. Will this negative trend continue or is it time for a bounce?
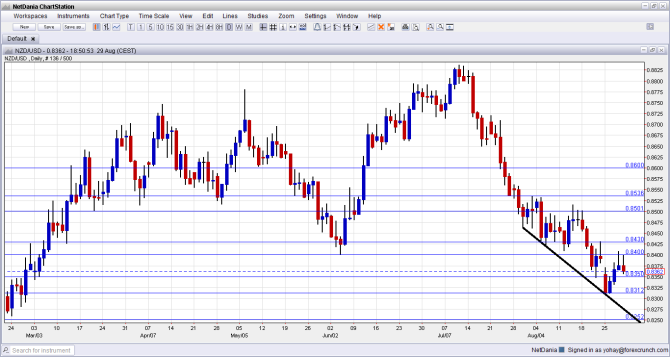
[do action=”autoupdate” tag=”NZDUSDUpdate”/]NZD/USD daily chart with support and resistance lines on it. Click to enlarge:
- Overseas Trade Index: Sunday, 22:45. This quarterly measure, also known as “Terms of Trade”, rose by 1.8% in Q1, lower than in previous quarters. A slowdown could be seen now for Q2, with a drop of 3.5%, as the strength of the kiwi dollar probably weighed on trading conditions.
- ANZ Commodity Prices: Tuesday, 1:00. This measure of commodity prices fell by 2.4% in July and could continue sliding in August. Commodity prices are critical for New Zealand’s economy, as the country exports food and especially milk.
* All times are GMT.
NZD/USD Technical Analysis
Kiwi/dollar started the week lower and lost support at 0.8350 (mentioned last week). It then continued lower but managed to stabilize and claw back up.
Live chart of NZD/USD:
[do action=”tradingviews” pair=”NZDUSD” interval=”60″/]Technical lines, from top to bottom:
We start from lower ground this week. The round number of 0.86, which worked as a cushion during May 2014. The 0.8535 capped the pair in early August 2014 and serves as minor resistance.
The round number of 0.85 returns to the chart and now defines the top of the range. 0.8430 is a low seen in early August 2014 and significant support at the bottom of the range at that time.
The round number of 0.84 was a swing low in June and also capped the pair in August. It is followed by 0.8350, which was the low recorded during August.
0.8312 was the low point in August 2014 and it also follows the downtrend support line. The next line is 0.8250, which provided some support back in February.
Further below, the round levels of 0.82 and 0.81 provide support.
Downtrend support
As the black line shows, the pair is trading alongside downtrend support since the end of July. This line worked perfectly well and allowed the pair to bounce back.
I remain bearish on NZD/USD
Falling business confidence and worries about the price of milk weigh on the kiwi. In addition, it is now somewhat further away from downtrend support and could slide to that direction. In the US, stronger growth will likely be followed by a reminder of strong jobs.
More kiwi: Can NZD/USD Continue Trading Higher?
Listen to a preview of September’s big events in the latest episode of Market Movers:
Further reading:
- For a broad view of all the week’s major events worldwide, read the USD outlook.
- For EUR/USD, check out the Euro to Dollar forecast.
- For the Japanese yen, read the USD/JPY forecast.
- For GBP/USD (cable), look into the British Pound forecast.
- For the Australian dollar (Aussie), check out the AUD to USD forecast.
- For USD/CAD (loonie), check out the Canadian dollar forecast.
