The Canadian dollar showed strong gains early in the week but was unable to consolidate and ended the week almost unchanged. USD/CAD closed the week at 1.1423. This week’s highlight is Building Permits. Here is an outlook on the major market-movers and an updated technical analysis for USD/CAD.
In the US, Non-Farm Payrolls report was outstanding with a 321K job gain in November and finally a bump in wages. Canadian job data failed to keep pace, as Employment Change shed 10.7 thousand jobs, its first decline in three months. However, Ivey PMI was unexpectedly sharp, rising to 56.9 points.
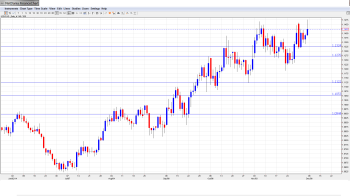
[do action=”autoupdate” tag=”USDCADUpdate”/]USD/CAD daily chart with support and resistance lines on it. Click to enlarge:
- Housing Starts: Monday, 13:15. Housing Starts slipped in October to 184 thousand, marking a seven-month low. This was well short of the estimate of 201 thousand. The markets are expecting a strong turnaround in November, with a forecast of 201 thousand.
- Building Permits: Monday, 13:30. This is the key event of the week. The indicator has looked solid, with four of the past five readings showing strong gains. The previous release came in at 12.7%, well above the estimate of 5.2%. The estimate for the upcoming releases stands at 2.1%.
- BOC Senior Deputy Governor Carolyn Wilkins Speaks: Wednesday, 16:15. Wilkins will hold a press conference in Ottawa. Remarks which are more hawkish than expected is bullish for the Canadian dollar.
- BOC Governor Stephen Poloz Speaks: Thursday, 13:00. Poloz will speak in New York City and then hold a press conference. The markets will be listening closely, as the event comes just a few days after the BOC maintained interest rates at 1.00%.
- NHPI: Thursday, 13:30. The New Housing Price Index is an important gauge of activity in the housing sector. The index has not shown much strength and posted a weak gain of 0.1% in October. Little change is expected in the upcoming release, with an estimate of 0.2%.
- Capacity Utilization Rate: Thursday, 13:30. This quarterly release is a leading indicator of consumer inflation, as a higher capacity usually translates into higher production costs which are passed to the consumer. The indicator came in at 82.7% in Q2, and little change is expected in the Q3 release.
* All times are GMT.
USD/CAD Technical Analysis
USD/CAD opened the week at 1.1453 and quickly touched a low of 1.1313. The pair reversed directions and climbed to a high of 1.1476, as support held at 1.1494 (discussed last week). USD/CAD closed the week at 1.1423.
Live chart of USD/CAD: [do action=”tradingviews” pair=”USDCAD” interval=”60″/]
Technical lines, from top to bottom:
We start at 118.72, which was a key resistance line in February 2007. It has remained intact since then.
1.1752 marked the start of a rally by the Canadian dollar in February 2007, which saw USD/CAD drop below parity. 1.1640 is next.
1.1494 weakened but held firm for the second straight week. This line has remained intact since July 2009.
1.1333 was tested by the pair but remains a strong support line as the pair climbed back above the 1.14 level.
1.1271 is providing strong support.
1.1122 marks the low point of a US dollar rally which started late in October and saw USD/CAD climb above 1.14 earlier in November.
1.1054 is providing support above the psychologically important line of 1.10.
1.0944 has held firm since late early September. It is the final support line for now.
I remain bullish on USD/CAD
US employment data stole the show last week, posting an excellent jobs report and some wage inflation as well. This should help ease concerns about whether the Fed remains on track for a rate hike in the first half of 2014. Canada continues to struggle with weak inflation and limited growth, so there’s room for the pair to move higher.
In our latest podcast, we preview December’s big events, talk about the importance of jobless claims, the crash in oil prices and GOFO going negative:

