The Australian dollar held its own against the strong US dollar last week, as AUD/USD closed the week at 0.8120. The final week of the year has only two releases. Here is an outlook on the major market-movers and an updated technical analysis for AUD/USD.
In the US, Final GDP for Q3 was excellent, with a rate of 5% annualized growth. Unemployment Claims looked sharp, but durable goods orders and housing data was rather weak. In the UK, it was a quiet week leading into Christmas and the Australian markets were on holiday on Wednesday and Thursday.
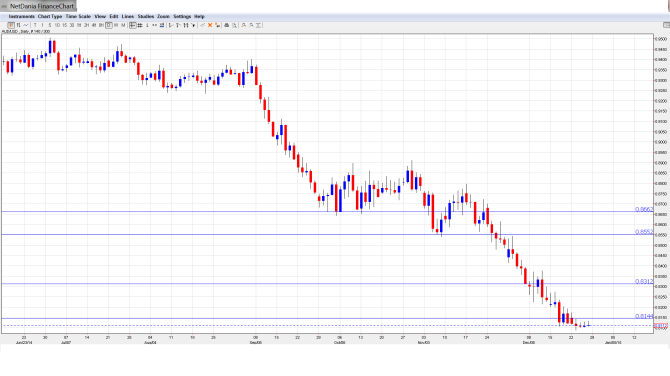
[do action=”autoupdate” tag=”AUDUSDUpdate”/]AUD/USD graph with support and resistance lines on it. Click to enlarge:
- Private Sector Credit: Wednesday, 00:30. The indicator has been moving upwards in recent readings and improved to 0.6% in November, a 4-month high. The December estimate stands at 0.5%.
- Chinese HSBC Final Manufacturing PMI: Wednesday, 1:45. The Aussie is sensitive to Chinese key numbers, as the Asian giant is Australia’s number one trading partner. The index has been trading close to the 50-point line, which separates between contraction and expansion. The December estimate stands at 49.5 points. Will the indicator beat the estimate and remain above the 50 line?
- Chinese Manufacturing PMI: Wednesday, 1:00. The PMI has lost ground in recent readings, slipping to 50.3 points in November, its weakest gain since March. The index is expected to continue to edge lower, with an estimate of 50.0 points.
- Commodity Prices: Friday, 5:30. Commodity Prices haven’t shown a monthly gain in close to three years. The November release posted a sharp drop of 18.6%, and little change is expected in the upcoming release.
* All times are GMT.
AUD/USD Technical Analysis
AUD/USD started the week at 0.8147 and touched a high of 0.8173, as the pair tested resistance at 0.8150 (discussed last week). The pair then dropped below the 0.81 line, dipping to 0.8088. AUD/USD closed the week at 0.8112.
Live chart of AUD/USD:
[do action=”tradingviews” pair=”AUDUSD” interval=”60″/]Technical lines from top to bottom:
0.8660 has held firm since late November. 0.8550 is next.
0.8456 switched to a resistance role in the first week of December and remains a strong line as the pair trades close to the 0.81 line.
0.8316 is the next line of resistance. It has held firm since mid-December.
0.8150 continues to see action. This line was tested as the pair showed small gains early in the week before retracting. It is currently a weak resistance line and could face pressure early in the week.
0.8013 is the last barrier in front of the psychologically critical line of 0.8000.
0.7978 was an important cap in January 2007.
0.7904 has provided support since July 2009.
0.7799 is the final support level for now. This line has remained intact since September 2008.
I am bearish on AUD/USD.
The Aussie has plunged in the past two months, as the currency has surrendered over 600 points since the start of November. Although trading will be light next week, the greenback’s upward momentum could produce some further gains next week.
In our latest podcast, we run down all aspects of the Fed decision, discuss the running down of oil, the run down Russian ruble and the weak currency down under:
Subscribe to our podcast on iTunes.
Further reading:
- For a broad view of all the week’s major events worldwide, read the USD outlook.
- For EUR/USD, check out the Euro to Dollar forecast.
- For GBP/USD (cable), look into the British Pound forecast.
- For the Japanese yen, read the USD/JPY forecast.
- For USD/CAD (loonie), check out the Canadian dollar forecast.
- For the kiwi, see the NZDUSD forecast.
