USD/JPY showed little change at the end of the week, closing at 123.82. This week has six events. Here is an outlook on the major events moving the yen and an updated technical analysis for USD/JPY.
In the US, the Federal Reserve remained cautious but did acknowledge improvement in the US economy. Advance GDP rebounded with a gain of 2.6% in Q2, but this fell short of the estimate. Over in Japan, Retail Sales slipped and inflation levels remained very low.
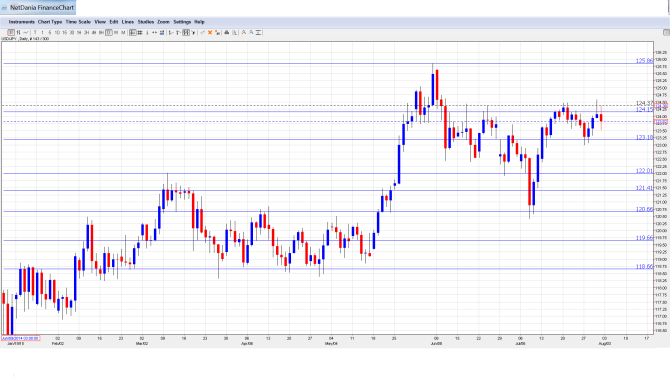
[do action=”autoupdate” tag=”USDJPYUpdate”/]USD/JPY graph with support and resistance lines on it:
- Final Manufacturing PMI: Monday, 1:35. The manufacturing index slipped to 50.1 points in June, within expectations. Little change is expected in the July release.
- Monetary Base: Monday, 23:50. The indicator dipped to 34.2% in June, shy of the forecast of 36.2%. The downward trend is expected to continue in July, with an estimate of 32.2%.
- Average Cash Earnings: Tuesday, 1:30. This indicator is linked to consumer spending, a key driver of economic growth. The indicator slipped to 0.6% in May but was within expectations. The markets are expecting a stronger reading in June, with a forecast of 0.9%.
- 10-year Bond Auction: Tuesday, 3:45. The yield on 10-year bonds rose to 0.51% in July, its highest yield since October. The June yield stood at 0.51%.
- Leading Indicators: Thursday, 5:00. This event is based on 11 economic indicators, but is considered a minor event since most of the data has already been released. The indicator dipped to 106.2% in May, matching the estimate. The forecast for June stands at 106.9%.
- Monetary Policy Statement: Friday, Tentative. With the Japanese economy struggling and weak inflation numbers, the BOJ is not expected to make any changes to its radical easing monetary stance. A press conference will follow the statement.
* All times are GMT
USD/JPY Technical Analysis
USD/JPY opened the week at 123.76 and quickly slipped to a low of 123.00, testing support at 123.18 (discussed last week). The pair then reversed directions and climbed to a high of 124.58. USD/JPY then retracted and closed the week at 1.2368.
Live chart of USD/JPY: [do action=”tradingviews” pair=”USDJPY” interval=”60″/]
Technical lines from top to bottom:
We begin with resistance at 1.2878. This marked the start of a yen rally in May 2002, which saw USD/JPY fall below the 116 line.
127.74 is the next line of resistance.
126.59 has remained intact since May 2002.
125.86 continues to be a strong resistance line.
124.16 was tested for a third straight week as the pair pushed higher before retracting. This line was an important cap in late June.
123.18 was tested in support and starts the week as in immediate support line.
122.01 is the next support level.
121.39 was breached in early July as the dollar started its current rally.
120.65 is protecting the symbolic 120 level.
119.65 was a key support line in April.
118.68 is the final support line for now.
I am bullish on USD/JPY
The pair remains at high levels, as the struggling yen is not getting any support from a weak Japanese economy. Over in the US, Q2 numbers have shown improvement after a lukewarm first quarter. The Federal Reserve is keeping a low profile but speculation remains high that rates will rise, perhaps as early as September.
In our latest podcast, we drill down the deals, the aGreekment and Iran and the market impact.
Further reading:
- For a broad view of all the week’s major events worldwide, read the USD outlook.
- For EUR/USD, check out the Euro to Dollar forecast.
- For the Japanese yen, read the USD/JPY forecast.
- For GBP/USD (cable), look into the British Pound forecast.
- For the Australian dollar (Aussie), check out the AUD to USD forecast.
- For the kiwi, see the NZDUSD forecast.
