USD/JPY posted slight losses in an uneventful week. The pair closed at 123.68. This week has six events. Here is an outlook on the major events moving the yen and an updated technical analysis for USD/JPY.
US numbers showed improvement this week, as New Home Sales jumped and unemployment claims dropped sharply. In Japan, the trade deficit widened, but matched the estimate.
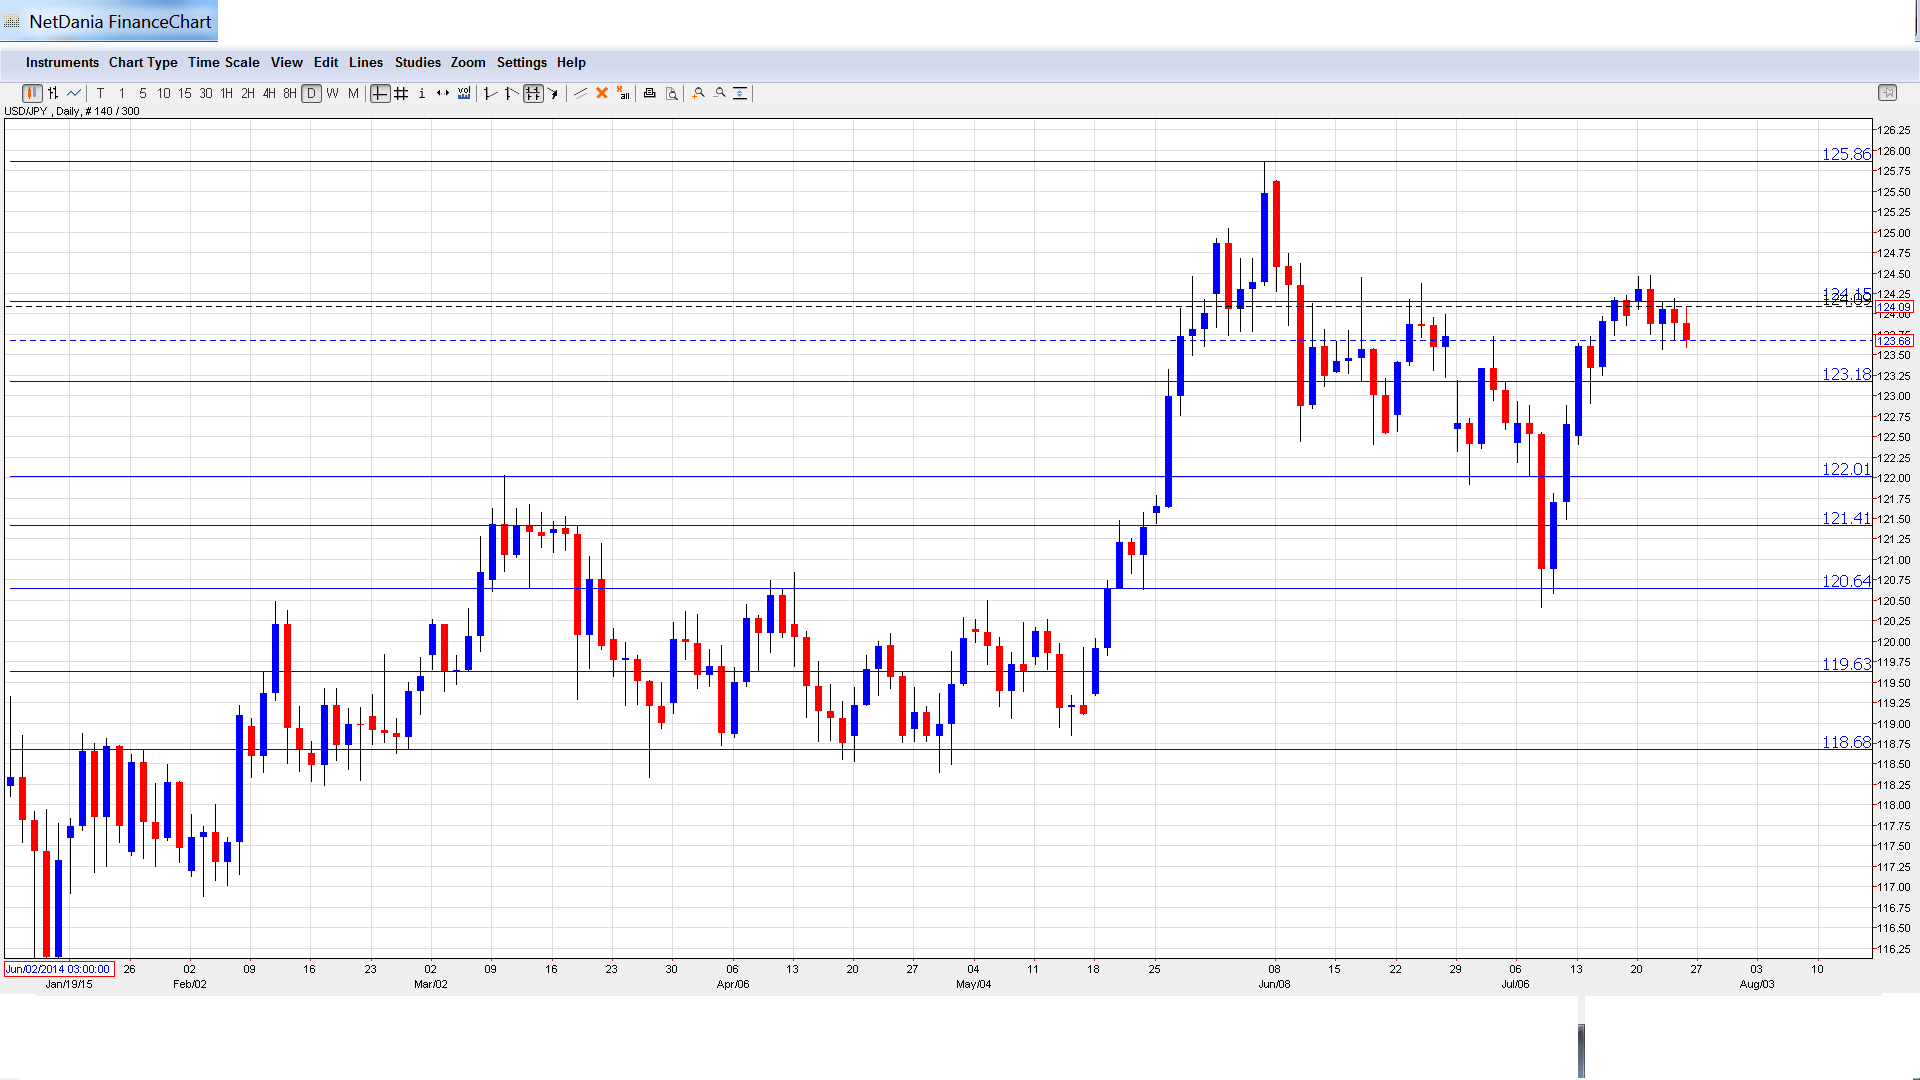
[do action=”autoupdate” tag=”USDJPYUpdate”/]USD/JPY graph with support and resistance lines on it:
- SPPI: Sunday, 23:50. This indicator measures inflation in the corporate sector. The May reading came in at 0.6%, within expectations. An identical reading is expected in the June release.
- Retail Sales: Tuesday, 23:50. Retail Sales is the primary gauge of consumer spending. The indicator has now posted two straight gains after a string of declines. The June reading came in 3.0%, easily beating the estimate of 2.1%. The forecast for the July report stands at 1.1%.
- Preliminary Industrial Production: Wednesday, 23:50. This manufacturing indicator disappointed in May with a sharp decline of 2.2%, well below the estimate of -0.8%. The markets are expecting better news in the July report, with an estimate of +0.4%.
- Household Spending: Thursday, 23:30. Household Spending is a key gauge of consumer spending, which is a critical component of economic growth. The indicator rebounded in May, with a sharp gain of 4.8%, well above the forecast of 3.5%. The markets are expecting a smaller gain in June, with the estimate standing at 2.0%. Will the indicator repeat and beat the prediction?
- Tokyo Core CPI: Thursday, 23:30. This indicator is the primary gauge of consumer inflation. The index has hovered at very low levels in recent months, and dipped to 0.1% in June, matching the forecast. A flat reading of 0.0% is expected in the July report.
- Housing Starts: Friday, 5:00. Housing Starts provides a snapshot of the level of activity in the housing sector. The indicator surged 5.8% in May, short of the forecast of 6.2%. The markets are expecting a smaller gain in the June reading, with a forecast of 3.2%.
* All times are GMT
USD/JPY Technical Analysis
USD/JPY opened the week at 124.14 and quickly climbed to a high of 124.47, testing resistance at 124.16 (discussed last week). The pair then dropped to a low of 123.57 and closed the week at 1.2368.
Live chart of USD/JPY: [do action=”tradingviews” pair=”USDJPY” interval=”60″/]
Technical lines from top to bottom:
We start with resistance at 1.2878. This marked the start of a yen rally in May 2002, which saw USD/JPY fall below the 116 line.
127.74 is the next line of resistance.
126.59 has remained intact since May 2002.
125.86 continues to be a strong resistance line.
124.16 tested for a second straight week. This line was an important cap in late June.
123.18 is a weak support line.
122.01 is the next support level.
121.39 was breached in early July as the dollar started its current rally.
120.65 is protecting the symbolic 120 level.
119.65 was a key support line in April.
118.68 is the final support line for now.
I am bullish on USD/JPY
Japan releases key inflation and consumer spending numbers this week, and the yen could soften if these numbers don’t meet expectations. In the US, stronger housing and job numbers have increased speculation about a rate hike by the Fed, perhaps as early as September. All eyes will be on the Fed policy statement later this week, as any hints about a rate hike could help the US dollar rally even higher.
In our latest podcast, we drill down the deals, the aGreekment and Iran and the market impact.
Further reading:
- For a broad view of all the week’s major events worldwide, read the USD outlook.
- For EUR/USD, check out the Euro to Dollar forecast.
- For the Japanese yen, read the USD/JPY forecast.
- For GBP/USD (cable), look into the British Pound forecast.
- For the Australian dollar (Aussie), check out the AUD to USD forecast.
- For the kiwi, see the NZDUSD forecast.
