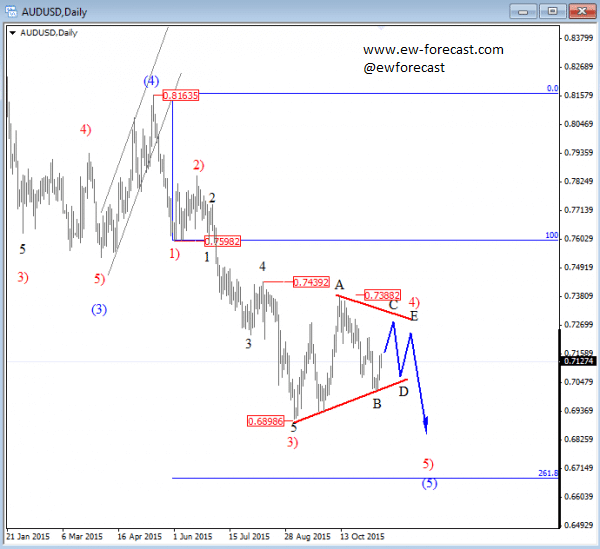
AUDUSD stays bearish rallied from 0.6900 in three waves, but based on the latest price action, we suspect that wave 4) will be much more complex than estimated earlier. We are looking at a triangle now that is placed within a downtrend of a blue wave (5) that will extend to around 0.6700 by the end of the year. After that we will look for a bullish reversal that could take place in 2016.
AUDUSD, Daily
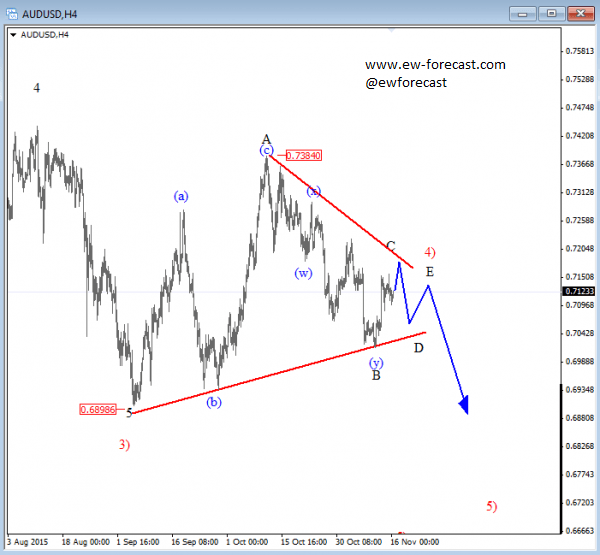
On the 4H chart, AUDUSD bounced higher last week, up to 0.7150 so it seems like that bears are not ready to take control just yet. On the updated chart we see wave 4) still in progress and the reason is a corrective structure from 0.7384. As such, this leg must belong to some bigger and more complex pattern. Our favorite idea is a triangle, so the current leg up can be wave C with limited upside around 0.7200-0.7250. Generally speaking, we still think that AUDUSD will hit new lows by the year end but seems that we will have to wait longer than initially thought.
AUDUSD, 4H
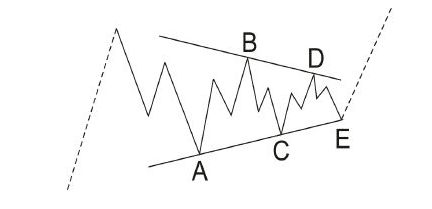
A Triangle is a common 5 wave pattern labeled A-B-C-D-E that moves counter-trend and is corrective in nature. Triangles move within two channel lines drawn from waves A to C, and from waves B to D. Triangles are overlapping five wave affairs that subdivide into 3-3-3-3-3.
Basic Triangle Pattern: