All eyes were on the Fed last week. As expected, the rates were left unchanged at 0.25%. However, the Fed broadly hinted that a December hike is a strong possibility. The RBA minutes indicated that the bank is not inclined to alter interest rates for the foreseeable future.
AUD/USD climbed 100 points last week, its strongest weekly gain since late July. The pair closed just above the 0.76 line. There are five events this week. Here is an outlook on the major market-movers and an updated technical analysis for AUD/USD.
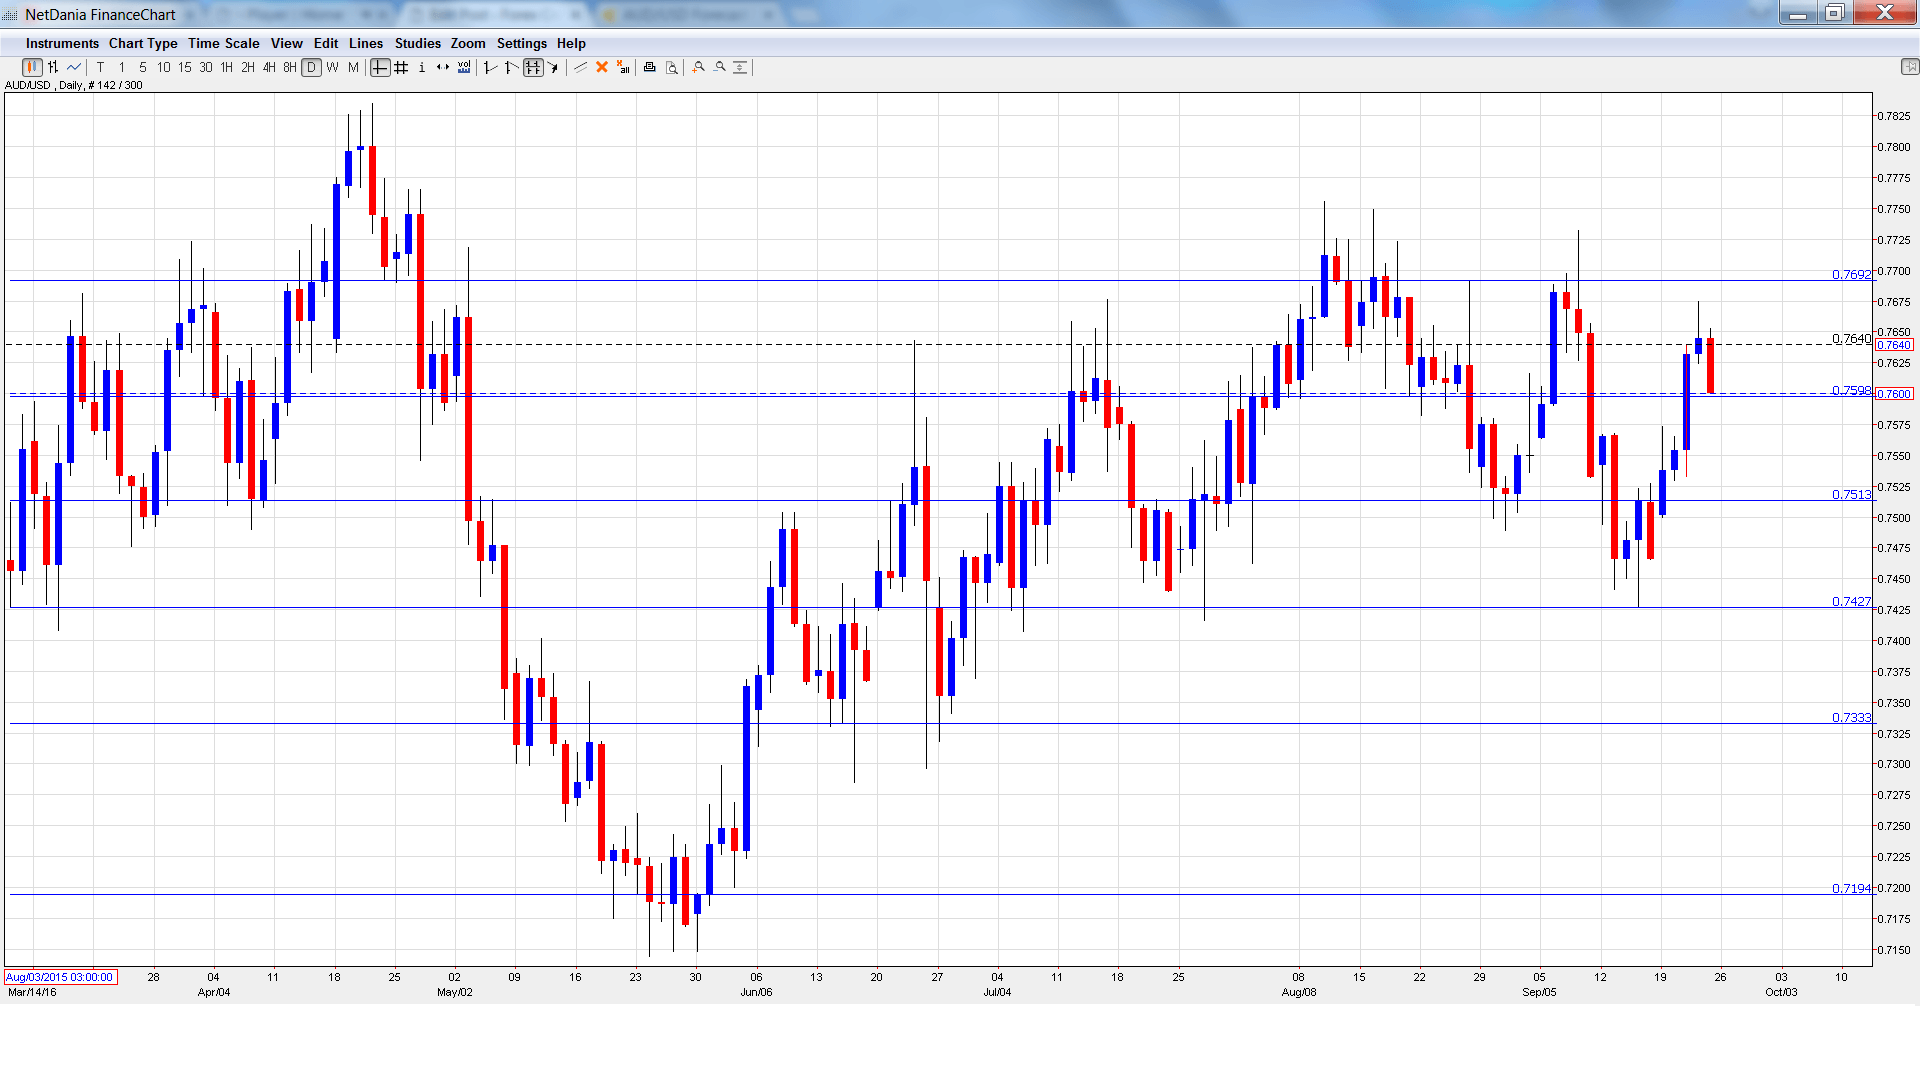
AUD/USD graph with support and resistance lines on it. Click to enlarge:
- RBA Assistant Governor Malcolm Edey Speaks: Monday, 12:20. Edey will deliver remarks at a financial conference in Melbourne. The markets will be looking for hints regarding future monetary policy.
- HIA New Home Sales: Friday, 1:00. This event provides a snapshot of the level of activity in the housing sector. The indicator has struggled lately, posting three declines in the past four months. The July reading was particularly weak, with a decline of 9.7%.
- Private Sector Credit: Friday, 1:30. Borrowing indicators are closely monitored, as higher borrowing levels often lead to increased spending. The indicator improved to 0.4% in July, matching the forecast. The estimate for the August release stands at 0.5%.
- Chinese Caixin Manufacturing PMI: Friday, 1:45. After showing contraction in the first half of the year, the indicator has stagnated at the 50-point level for the past two months. Little change is expected in the August release, with a reading of 50.1 points.
- Chinese Manufacturing PMI: Saturday, 1:00. The index posted a slight improvement in July, with a reading of 50.4 points. This beat the estimate of 49.9 points. The forecast for the August reading stands at 50.5 points.
AUD/USD Technical Analysis
AUD/USD opened the week at 0.7501. After touching a low of 0.7500, the pair climbed sharply to a high of 0.7675, as resistance held firm at 0.7692 (discussed last week). AUD/USD retracted late in the week and closed at 0.7608.
Live chart of AUD/USD:
Technical lines from top to bottom:
We begin with resistance at 0.8019, which has held firm since May 2015.
0.7938 is next.
0.7835 has been a cap since April.
0.7692 held firm as the pair posted strong gains last week.
0.7597 has switched to support. It is a weak line and could see further action early in the week.
0.7513 is next.
0.7427 is the low point for the month of September.
0.7334 was a cap in December 2015.
0.7192 is the final support level for now.
I remain bearish on AUD/USD
The Fed didn’t raise rates but its stance is hawkish regarding a rate hike in December. The RBA has already made two cuts this year and softer inflation numbers could lead the bank to make another move before the end of the year.
Our latest podcast is titled Bold BOJ vs. Fearful Fed
Follow us on Sticher or iTunes
Further reading:
- For a broad view of all the week’s major events worldwide, read the USD outlook.
- For EUR/USD, check out the Euro to Dollar forecast.
- For the Japanese yen, read the USD/JPY forecast.
- For GBP/USD (cable), look into the British Pound forecast.
- For the Canadian dollar (loonie), check out the Canadian dollar forecast.
- For the kiwi, see the NZD/USD forecast.
