AUD/USD continued to lose ground last week. The pair closed at 0.7466. This week’s key event is the RBA minutes. Here is an outlook on the major market-movers and an updated technical analysis for AUD/USD.
Australian employment data was a major disappointment as Employment Change declined 3.9 thousand, well short of expectations. US numbers were mixed last week. Retail sales contracted and missed expectations. However, CPI and jobless claims were slightly better than expected.
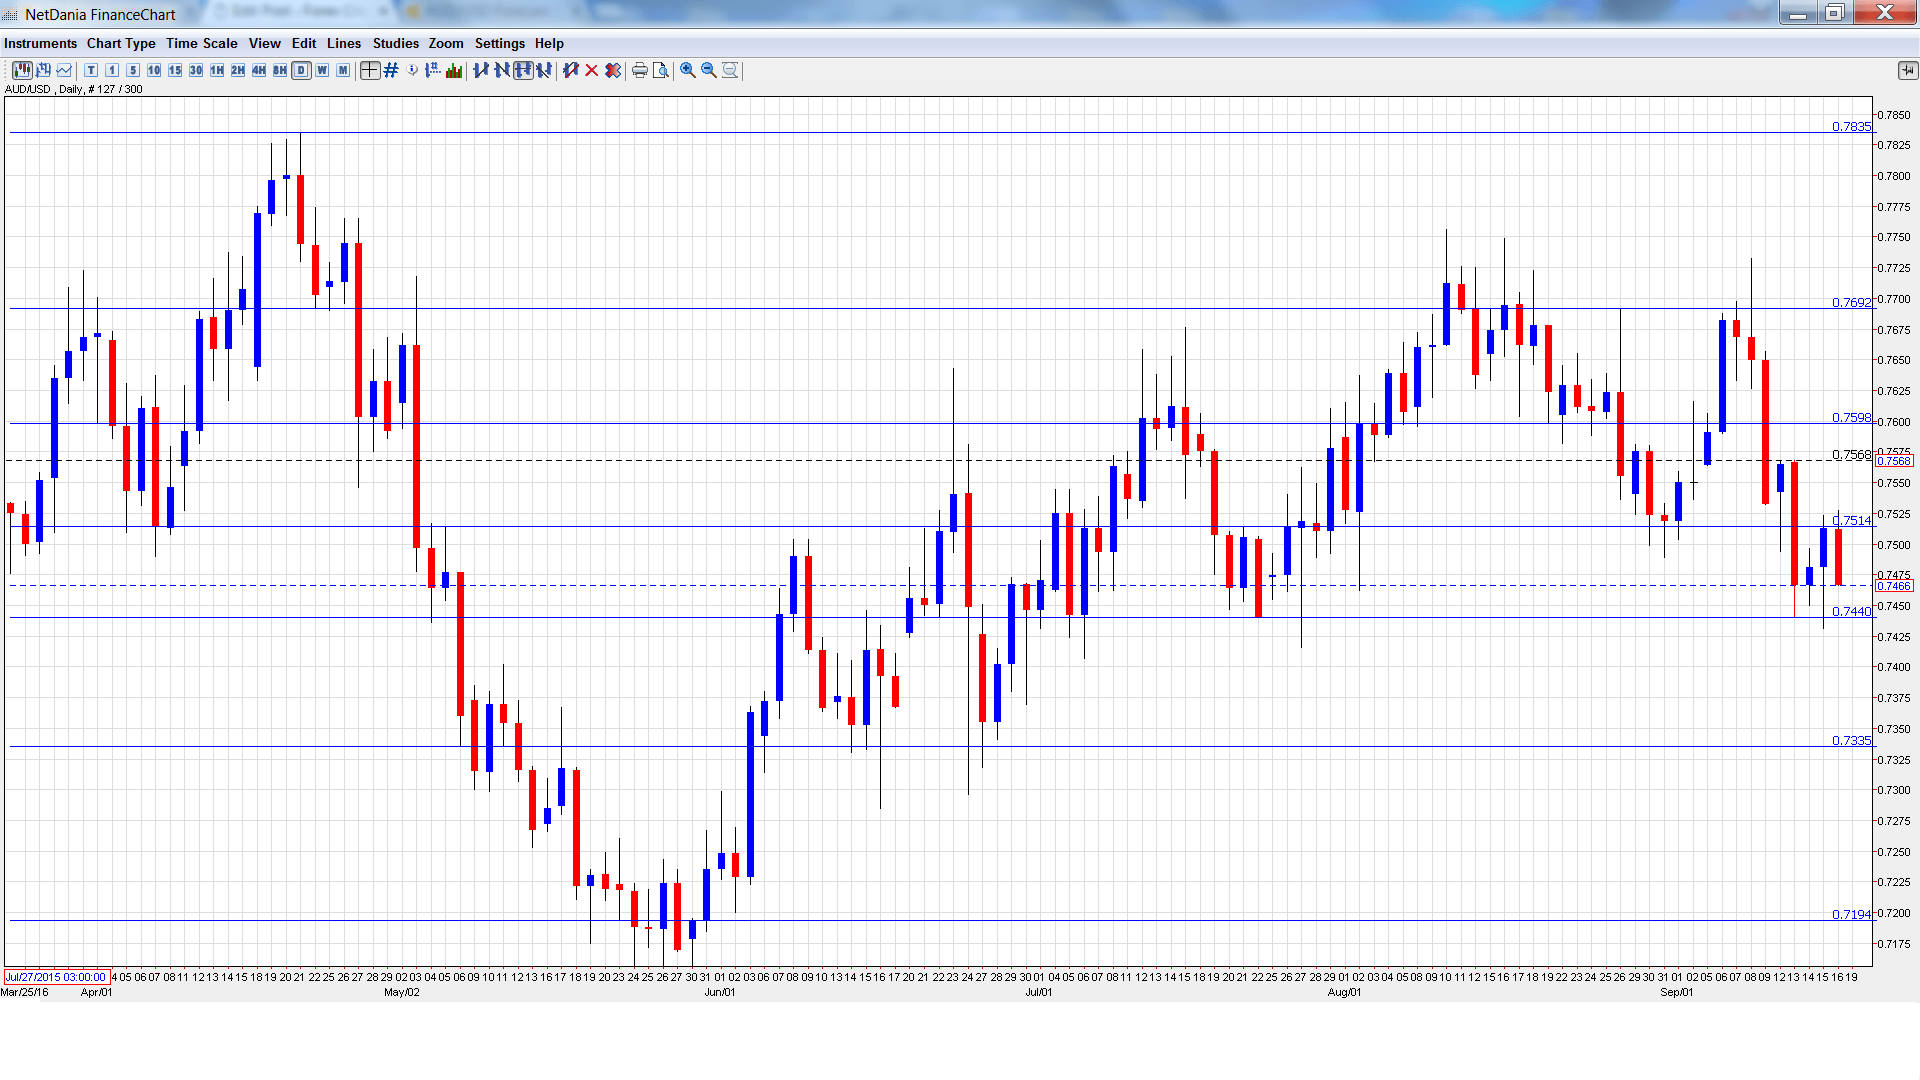
AUD/USD graph with support and resistance lines on it. Click to enlarge:
- CB Leading Index: Monday, 14:30. This minor event is based on 7 economic indicators. The indicator has been steady, posting two straight gains of 0.1%.
- RBA Monetary Policy Meeting Minutes: Tuesday, 1:30. The RBA minutes provide details of the RBA policy meeting earlier in September. At the meeting, the RBA maintained rates at 1.50% and said that the lower exchange rate had helped the economy.
- HPI: Tuesday, 1:30. This housing indicator helps gauge the level of activity in the housing sector. The index declined 0.2% in the second quarter, well short of the estimate of a 0.8% gain. This marked the first decline since 2012. The markets are expecting a strong turnaround in Q3, with an estimate of 3.1%.
- Mid-Year Economic and Fiscal Outlook: Wednesday, 00:30. This indicator updates the economic and fiscal outlook of the previous budget and takes into account all major events since the budget, which was released in May. Traders should treat this release as a market-mover.
AUD/USD Technical Analysis
AUD/USD opened the week at 0.7542. The pair quickly touched a high of 0.7568, before dropping sharply. AUD/USD fell to a low of 0.7431 late in the week, testing support at 0.7438 (discussed last week). The pair closed the week at 0.7466.
Live chart of AUD/USD:
Technical lines from top to bottom:
We begin with resistance at 0.7938.
0.7835 has provided resistance since April.
0.7692 is next.
0.7597 has strengthened following the pair’s losses last week.
0.7513 has switched to a resistance line.
0.7438 is a weak support level. It could break early in the week if the Aussie’s slide continues.
0.7334 was a cap in December 2015.
0.7192 is next.
0.7105 is the final support level for now.
I remain bearish on AUD/USD
The RBA has already lowered rates twice this year, and if inflation falters or the exchange rate jumps, the bank will certainly consider another quarter-rate cut. It’s the opposite story in the US, with a rate hike still a reasonable possibility in December.
Our latest podcast is titled Brexit: Bad, Bearable or Brilliant?
Follow us on Sticher or iTunes
Further reading:
- For a broad view of all the week’s major events worldwide, read the USD outlook.
- For EUR/USD, check out the Euro to Dollar forecast.
- For the Japanese yen, read the USD/JPY forecast.
- For GBP/USD (cable), look into the British Pound forecast.
- For the Canadian dollar (loonie), check out the Canadian dollar forecast.
- For the kiwi, see the NZD/USD forecast.
