The New Zealand dollar had a mixed week. Two events are scheduled for the last week of March. Here is an analysis of fundamentals and an updated technical analysis for NZD/USD.
The RBNZ said its word and tried to talk down the kiwi dollar. However, Wheeler and his team do not seem too worried about the weak growth rate. In the US, Trump’s healthcare law woes hurt the US dollar.
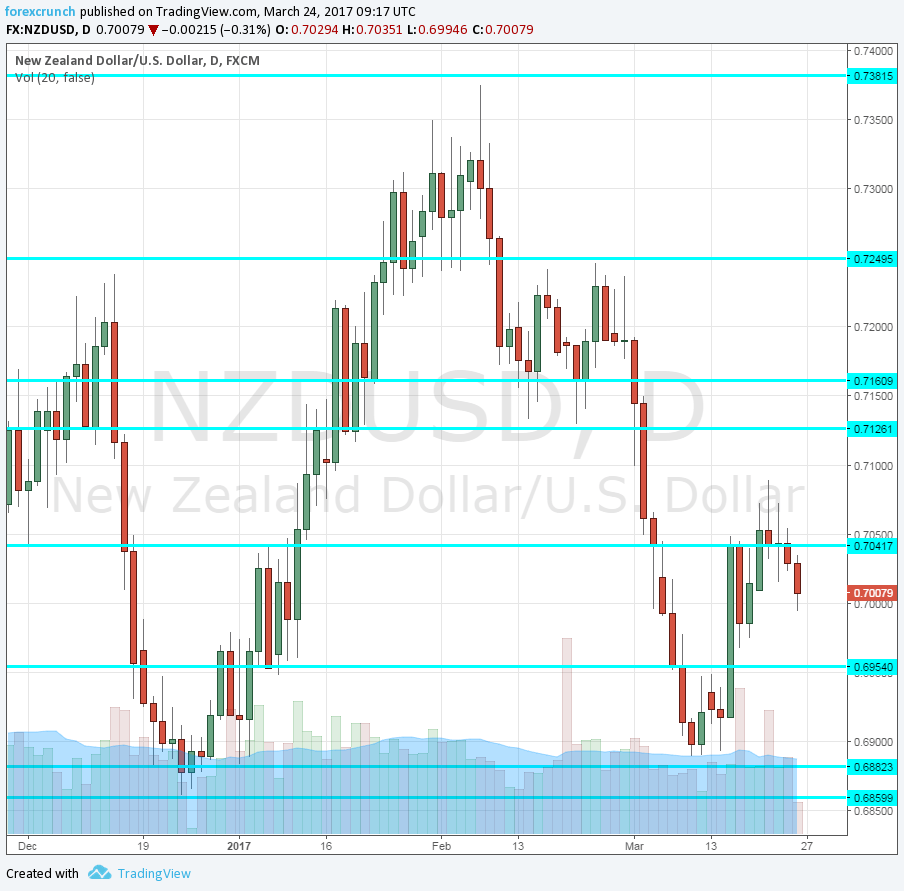
[do action=”autoupdate” tag=”NZDUSDUpdate”/]NZD/USD daily graph with support and resistance lines on it. Click to enlarge:
- Building Consents: Thursday, 21:45. This indicator provides an insight about the housing sector in New Zealand despite being quite volatile. After two months of significant downfalls, approvals ticked up by 0.8%.
- ANZ Business Confidence: Friday, 00:00. This survey of 1500 businesses slipped in February to 16.6 points, the lowest since August. A similar figure is expected for March. Any positive number reflects optimism.
NZD/USD Technical Analysis
Kiwi/dollar had a wobbly week, trading initially between the 0.6960 and 0.7040 lines mentioned last week.
Technical lines, from top to bottom:
0.7380 was the high recorded back in February and is our top line for now. Below, we find 0.7250, which capped the pair back twice in mid-February and serves as a double top.
0.7160, which capped the pair back in November is a pivotal line within the range. 0.7125 worked as a double bottom before it collapsed in early March.
0.7050 served as resistance during the month of March. The very round number of 0.70 is a battle zone. Further below, 0.6960 worked as support in November and then in January once again.
Further below, 0.6960 worked as support in November and then in January once again. The round number of 0.69 is weak support and it is followed by 0.6865.
I remain bearish on NZD/USD
Despite some weakness in the US dollar, the New Zealand dollar is still licking its wounds from the RBNZ decision.
Our latest podcast is titled Murky markets and further Fed fallout
Follow us on Sticher or iTunes
Safe trading!
