The Australian dollar seemed to have suffered more than most from the fears of a trade war. Will it continue lower? The week leading into Easter is light on events. Here are the highlights of the week and an updated technical analysis for AUD/USD.
The US dollar dropped on the dovish hike from the Fed (no upgrade in rate increases for 2018) and the new tariffs on China. Australia was officially made exempt from the tariffs on steel and aluminum but the Australian dollar still suffered alongside stocks. Australia’s unemployment rate ticked up to 5.6% and that may partly explain the slide, but the participation rate also increased. The change in employment was +17.5K, within expectations. Australian home prices rose by 1% and other figures were OK as well.
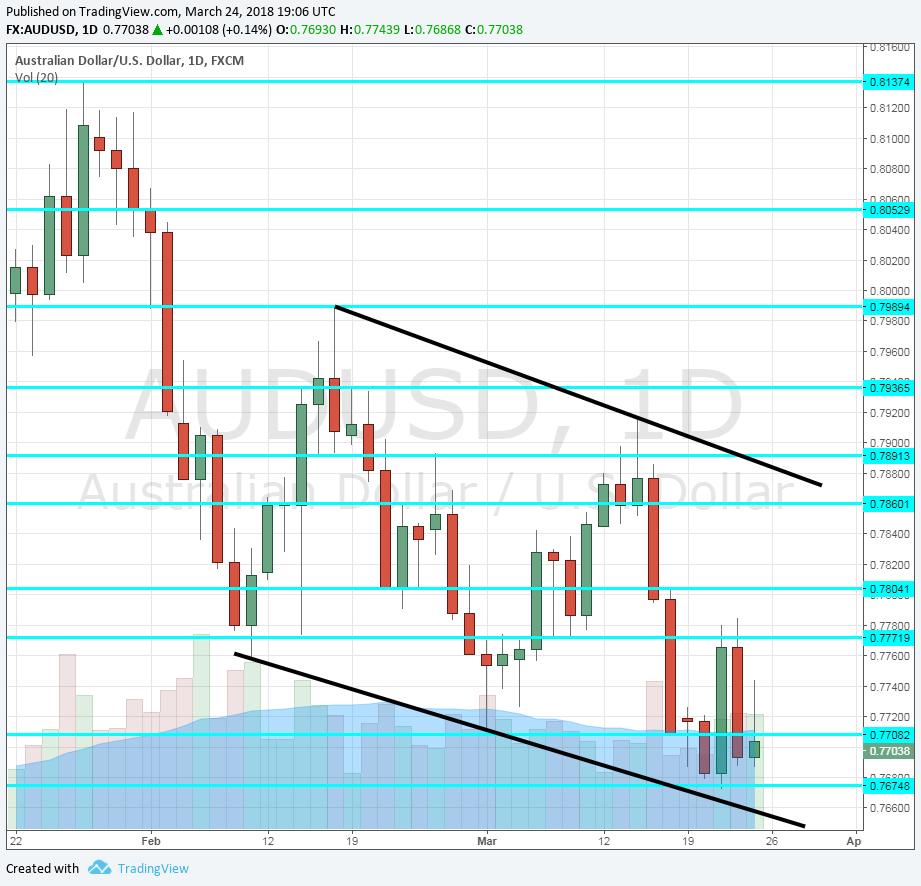
[do action=”autoupdate” tag=”AUDUSDUpdate”/]AUD/USD daily graph with support and resistance lines on it. Click to enlarge:
- HIA New Home Sales: Tuesday. Housing Industry Association’s gauge of sales of new homes fell in January by 2.1% after two months on the rise. A rebound may be seen now.
- Christopher Kent talks: Tuesday, 00:45. The RBA Assistant Governor talks in Sydney and may shed light on future monetary policy. The central bank has not changed its policy since August 2016 and is projected to stay put through 2018.
- Private Sector Credit: Thursday, 00:30. Expanding credit implies heightened economic activity, but Australia suffers from a debt overhang. After seeing an increase of 0.3% in January, the same increase is projected for February.
*All times are GMT
AUD/USD Technical Analysis
Aussie/USD reached new lows at 0.7675 before staging a minimal bounce, recapturing the round 0.77 level mentioned last week.
Technical lines from top to bottom:
0.8050 capped the pair in August and also temporarily in January, on its way up. 0.7990 was the high point in February and protects the 0.80 level.
0.7890 worked as support in February and resistance in October. 0.7760 was the low point in mid-February and works as support.
The round level of 0.77 was resistance in December. The new low of 0.7675 is next.
Lower, 0.7650 worked as resistance in several occasions in late 2017. The last line to watch is the round 0.75 level.
Downtrend channel
As the thick black lines show, the pair is trading in a downtrend channel. This is a bearish sign.
I am bearish on AUD/USD
The Australian dollar showed its weakness when its commodity currency peers advanced. It may extend its slide in the next turndown.
Our latest podcast is titled Fed Day and Underwhelming Oil
Follow us on Sticher or iTunes
Further reading:
- EUR/USD forecast – for everything related to the euro.
- GBP/USD forecast – Pound/dollar predictions
- USD/JPY forecast – projections for dollar/yen
- USD/CAD forecast – Canadian dollar analysis
- Forex weekly forecast – Outlook for the major events of the week.
Safe trading!
