- Ethereum price is up 1.3% on the day, but gains have been capped within the narrow end of the contracting triangle pattern.
- The 61.8% Fibonacci has highlighted stronger support slightly above $560.
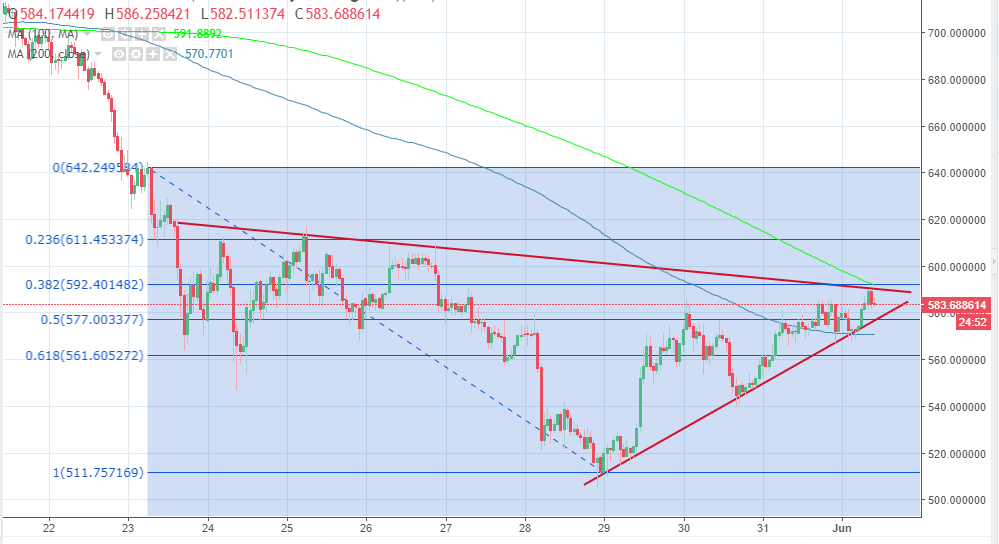
Ethereum price is extending gains at the end of the week but only marginally above the key resistance at $580. It is up 1.17% on the day, but gains have been capped within the narrow end of the contracting triangle pattern. The 50 SMA is a breakout to the upside close to $590; a break past this level will pave the way for further gains towards $600.
The 38.2% Fib retracement level with the last high leg at $642 and a low of $511 coincides with the 50 SMA, which means $590 is a significant hurdle. The previous resistance level at $580 will offer short-term support in case of a reversal.
Significantly, the short-term contracting triangle is supported at $572, moreover, the 200 SMA presents another support area at $570. In addition to that, the 61.8% Fibonacci has highlighted stronger support slightly above $560. The zone at $590 is a vital breakout point towards the next key resistance zone at $600. On the downside, the 200 SMA ($570) is another breakout zone.