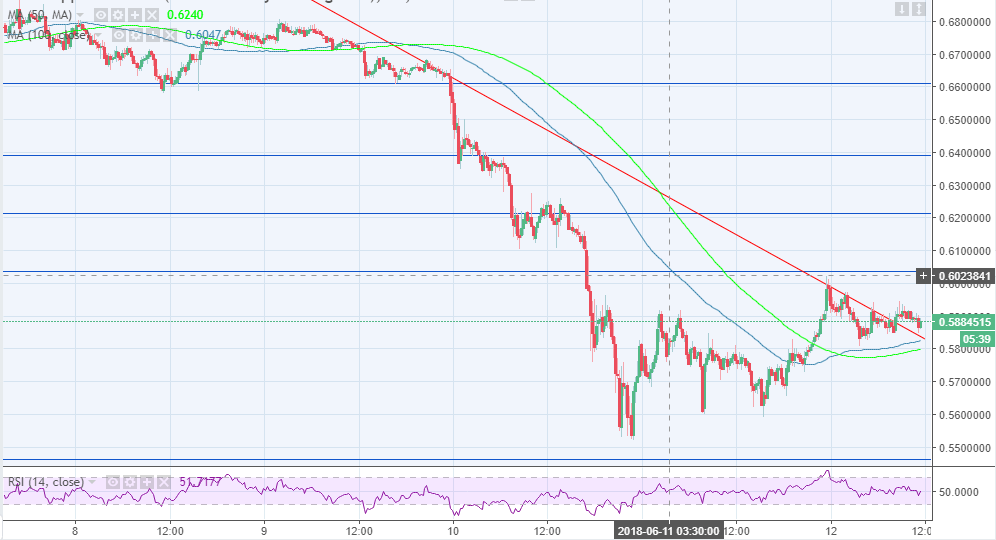
- Ripple price is trading marginally above $0.58, although the charts show a 1.69% drop on the day.
- The 61.8% Fibo marks a breakout toward the key resistance zone at $0.68.
Ripple price has broken above the bearish trendline in an effort to recover from the dip it sunk into over the last weekend. The digital asset is trading marginally above $0.58, although the charts show a 1.69% drop on the day. For two days now, the upside has been limited below $0.69 resistance level. Indicators on the chart point towards recovery but the current momentum is weak.
Applying Fib retracement levels place the next breakout slightly above the short-term resistance at $0.60. The 61.8% Fib retracement level with the last swing high of $0.69 and a low of $0.54 will pave the way for XRP/USD to test the key resistance at $0.68, before gathering momentum to recoil towards $0.70.
Both the 50 SMA and the 100 SMA have changed direction slightly upwards to show that selling pressure is dying down. The descending trendline, on the other hand, will offer support in case the weak support gives in. The moving averages could support the price above $0.58. Significantly, XRP/USD will be supported at $0.57 – $0.55 support zone in the event declines extend.
XRP/USD 15 minutes chart

