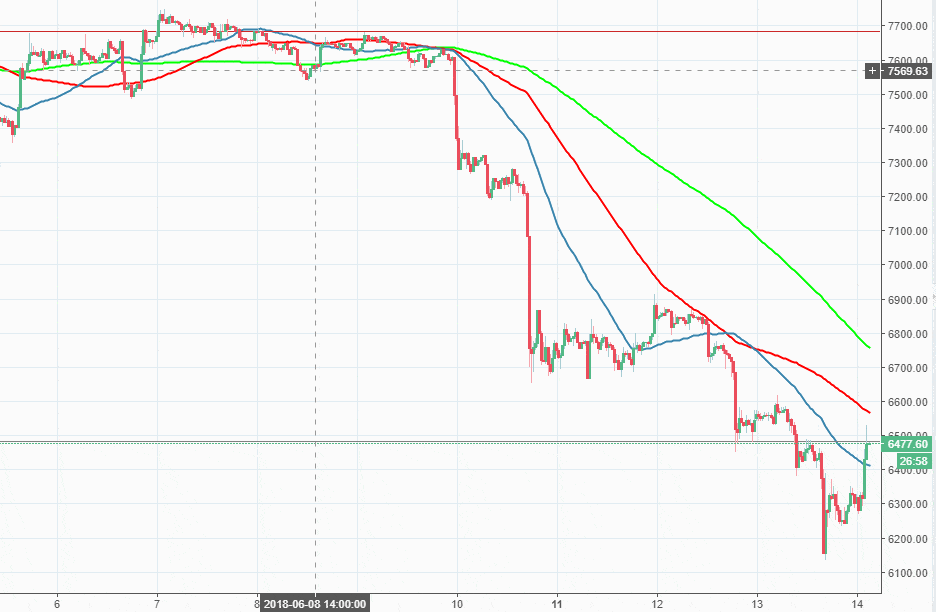
- Bitcoin up nearly 3% since the beginning of the day, capped by $6,500.
- Research shows, that Bitcoin price was inflated artificially.
BTC/USD is changing hands at $6,480, the price of the digital coin No. 1 recovered strongly from a new low reached late on Wednesday at $6,154. The coin gained nearly 3% since the start of the day amid growing trading volumes.
Fake bubble?
At the end of May the US Department of Justice launched an investigation into Bitcoin price manipulations, now academicians have joint the blame game. John Griffin, a finance professor at the University of Texas, and Amin Shams, a graduate student published a research paper that reveals that half of the Bitcoin price increase might have been orchestrated by a handful of big players.
The researches analyzed the flows of digital tokens in and out of Bitfinex, one of the largest and least regulated exchanges in the industry, and revealed some clear patterns of successful manipulations aimed at pushing the price higher
“There were obviously tremendous price increases last year, and this paper indicates that manipulation played a large part in those price increases,” Mr. Griffin said, as quoted by The New York Times.
The researchers sift through millions of transaction record available in public ledgers and came to the conclusion that a secondary virtual currency, known as Tether was used for that purpose. They found that half of the increase in Bitcoin’s price in 2017 could be traced to the hours immediately after Tether flowed to a handful of other exchanges, generally when the price was declining.
Bitfinex declined the allegations.
Bitcoin’s technical picture
From the short-term perspective, BTC/USD recovery is capped by $6,500. If this level is broken, the upside may be extended towards $6,572 (100-SMA, 30-min chart) with the next bullish aim $6,700. On the downside, the local support is produced by 50-SMA (300min chart) at $6,414 and followed by $6,300. Once it is broken, Wednesday’s low at $6,154 will come into view once again.
BTC/USD, 30-min chart

