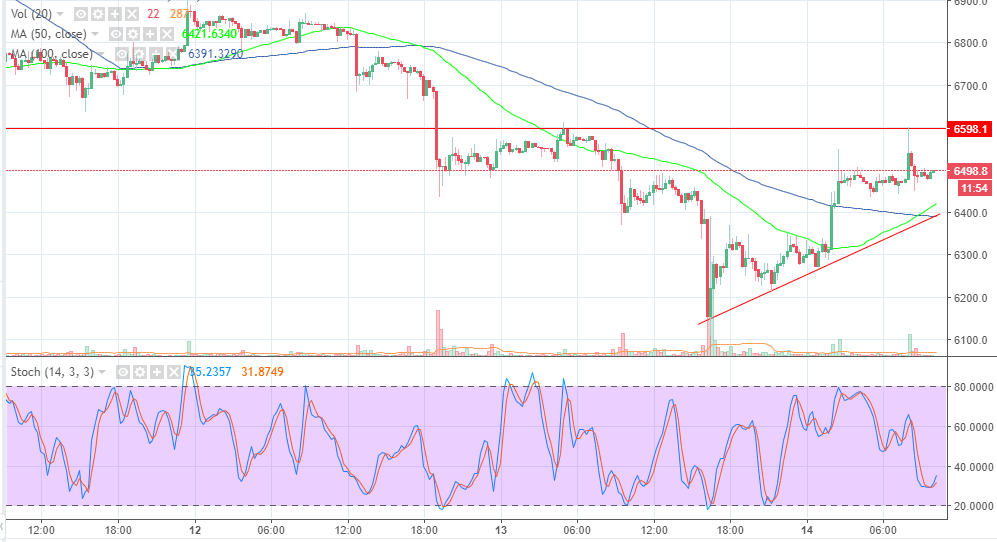
- BTC/USD is supported weakly at $6,450, but the moving averages and bullish trendline will offer more support at $6,400.
- The 50 SMA has crossed above the 100 SMA to signal that the buyers are gaining more control.
Bitcoin price has embarked on upward movement after sliding below $6,200 but found a support at $6,150. The price bounced off the support and cleared the short-term resistance at $6,300 before another spike that culminated in a bullish flag pattern supported above $6,400.
The stochastic on the 15′ timeframe chart is at 30% and showing signals of bullish movements in the short-term. The 50 SMA has crossed above the 100 SMA to signal that the buyers are gaining more control. BTC/USD is currently flirting with $6,500, while the immediate resistance has capped the intraday highs at $6,550.
Bitcoin price is forming a bullish flag pattern pending another upside retracement that will see it brush shoulders with the immediate supply zone at $6,600 -$6,700. Trading above this zone will allow the bulls to gain momentum to tackle the key resistance level at $6,800. On the flipside, BTC/USD is supported weakly at $6,450, but the moving averages along with the bullish trendline will offer more support at $6,400. If the declines extend, BTC/USD will slide to the demand zone at $6,200, a move that could see it test the February lows below $6,100.
BTC/USD 15′ chart

