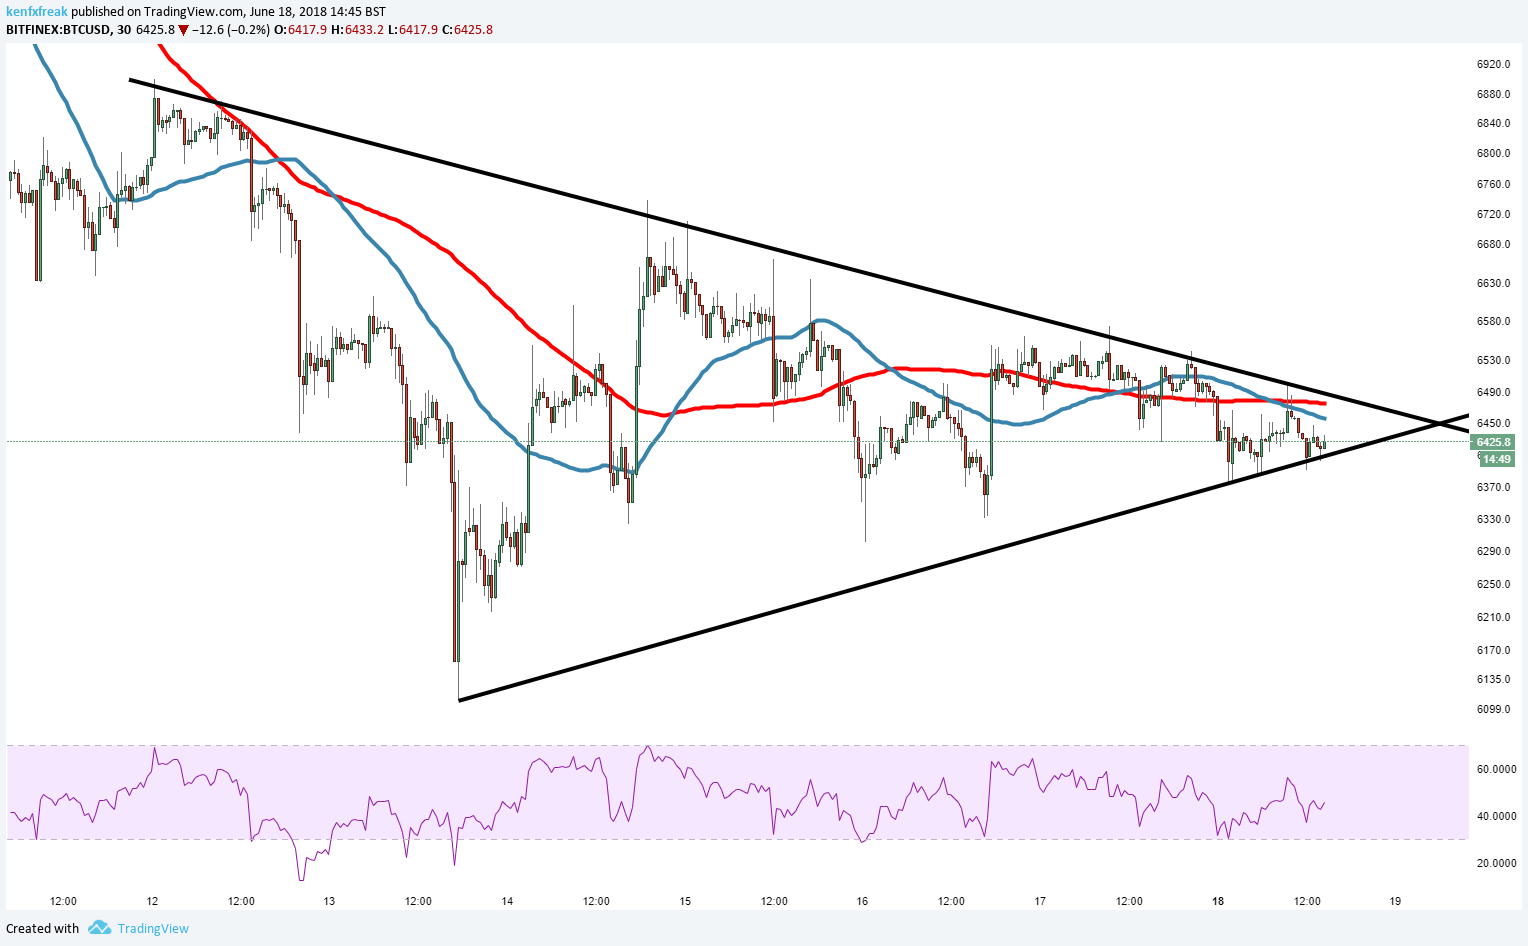
- Bitcoin price action is very much muted on Monday, sticky within a strong touted demand zone.
- BTC/USD has been struggling to make any form of committed direction, between $6100-6500.
- Given current price behaviour it would suggest that a potential breakout is imminent.
BTC/USD 30-minute chart
Spot rate: 6427.7
Relative change: -0.20%
High: 6370.8
Low: 6500.6
Trend: Neutral/Bearish
Support 1: 6370.0, (support on 30-minute chart).
Support 2: 6300.8 16th lows.
Support 3: 6108.3, 13th June low & (support on 30-minute chart).
Resistance 1: 6455.6, 50MA.
Resistance 2: 6475.5, 100MA & descending trend line.
Resistance 3: 6572.6, 17th June high.

