Home Ripple Technical Analysis: XRP/USD encounters a big bear bite as the price tanks some 6%, breaking critical near-term support, lowest level since December 2017
Crypto News

Ripple Technical Analysis: XRP/USD encounters a big bear bite as the price tanks some 6%, breaking critical near-term support, lowest level since December 2017

  • Ripple price came under heavy selling pressure overnight and into Friday’s session, as critical support is broken.
  • XRP/USD is forced to give up support seen at 24th June lows at $0.4384.


XRP/USD 30-minute chart
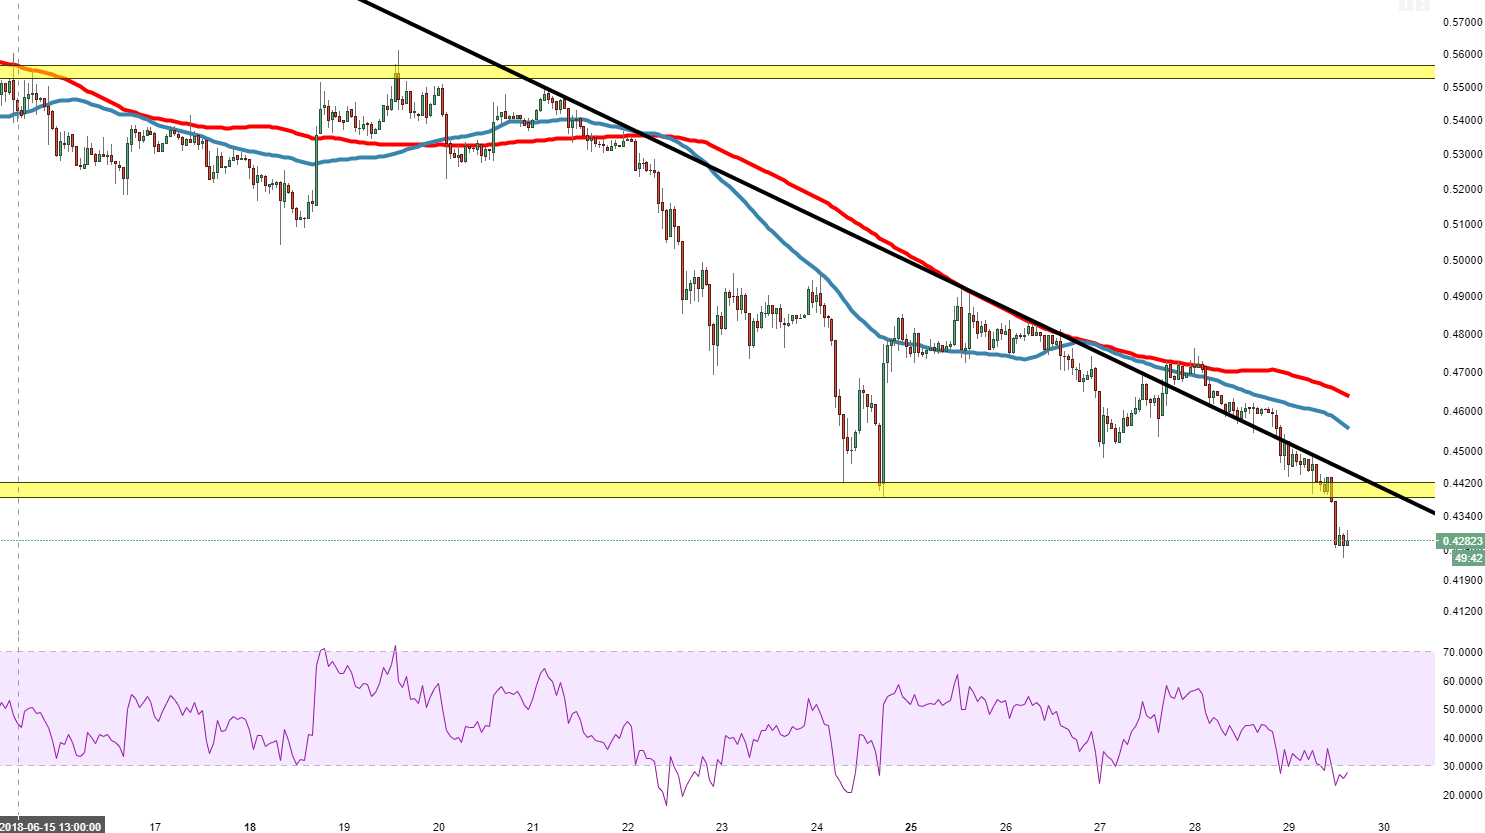
 

Spot rate:                                     0.4282

Relative change:               -4.10%

High:                                                   0.4501

Low:                                                      0.4240


Trend:                                                 Bearish


Support 1:                                  0.4246, today’s (Friday) low.

Support 2:                                    0.4218, 22nd December.

Support 3:                                    0.3516, 13th December.  

Resistance  1:                          0.4385, previous demand zone.

Resistance 2:                          0.4450, descending trend line.

Resistance 3:                           0.4470, 50MA.

FX Street

FX Street

FXStreet is the leading independent portal dedicated to the Foreign Exchange (Forex) market. It was launched in 2000 and the portal has always been proud of their unyielding commitment to provide objective and unbiased information, to enable their users to take better and more confident decisions.