- The 100 SMA on the 15′ timeframe chart will offer support close to the 38.2% Fibo ($750).
- The stochastic RSI is pointing towards continued bullish movements in the near-term.
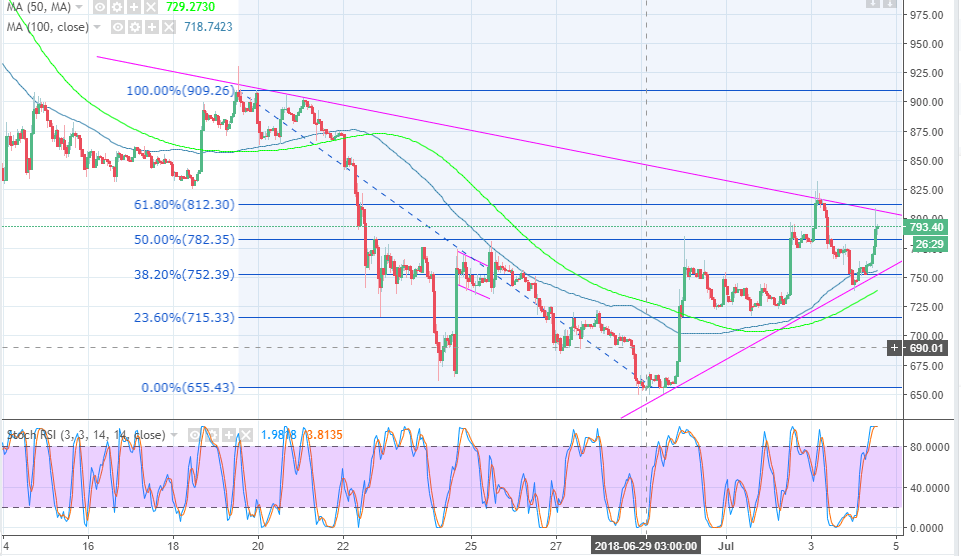
Bitcoin Cash has jumped more than 3% on the day after a brief but bullish trend swept across the crypto market on Wednesday. BCHUSD lost momentum at the 61.8% Fibonacci level with the last high of $910.5 and a low of $665.8 marginally close to $812. Another decline took place in after the opening of the session and during Asian trading hours but protected above $730.
At the moment, Bitcoin Cash price is consolidating in a contracting triangle pattern after encountering selling activity above $800. After recovering from the pits testing the support at $650 BCH/USD has been trading higher lows and higher highs since the beginning of the week. The crypto is testing the short-term resistance at $800, but the intraday upward movements are still limited below the bearish trendline on the chart.
If Bitcoin Cash can break above $800 and fight for a higher support, it is likely to open the gate to recoil towards $850 and eventually $900. But in the meantime, the 100 SMA on the 15′ timeframe chart will offer support close to the 38.2% Fibo ($750). Other highlighted support areas include $725, $700 and $650 (major support or demand zone). The stochastic RSI is pointing towards continued bullish movements in the near-term, similarly, the gap between the 50 SMA and the 100 SMA is reducing to confirm the bullish trend.
BCH/USD 15′ chart