Home Bitcoin Technical  Analysis: BTC/USD comes crashing down, after failing once again to break rising channel to the upside
Crypto News

Bitcoin Technical  Analysis: BTC/USD comes crashing down, after failing once again to break rising channel to the upside

  • Bitcoin comes crashing down by as much 5% in the session on Wednesday, large cooling seen across the board.
  • BTC/USD bulls failed to break through the rising channel pattern, after another rejection.  
  • Perhaps a flushing of buyers prior to a return of the bull run, time will tell, as there was a general high expectation for the month of September across the market.  


BTC/USD 4-hour chart  
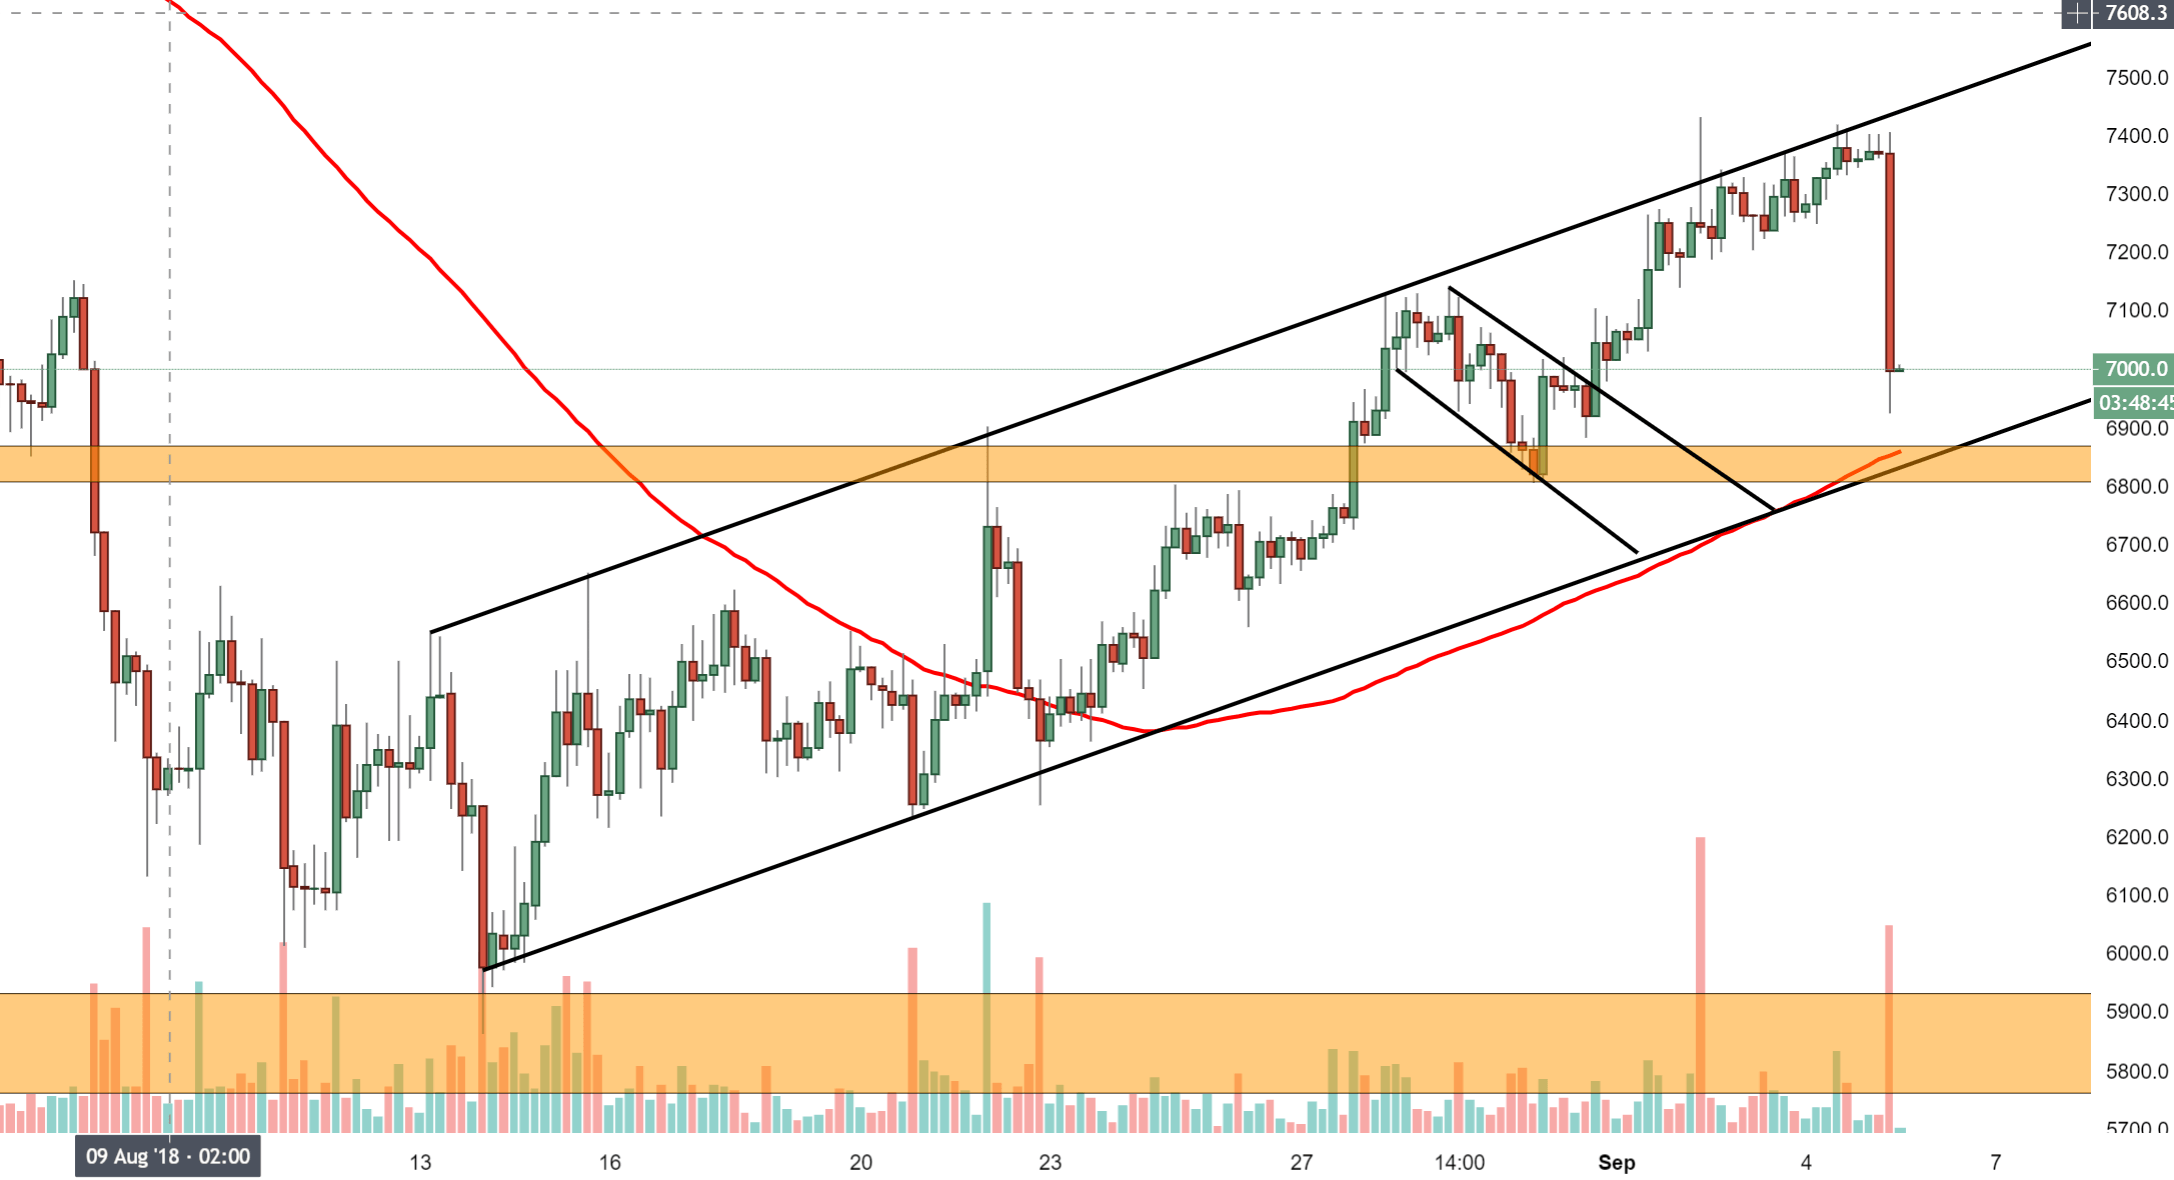


Spot rate:                    7000.0

Relative change:        -4.48%

High:                           7404.0

Low:                            6921.5


Trend:                         Bearish


Support 1:                   6860.1, 100MA and demand area.  

Support    2:                  6812.7,  lower part of rising channel.  

Support    3:                  6720.0, consolidation area 26-27 Aug, before bull run.

Resistance 1:              7120.0, top area 29th August.  

Resistance 2:             7445.5, upper part of rising channel.

Resistance 3:             7509.0, big  psychological  resistance.  


FX Street

FX Street

FXStreet is the leading independent portal dedicated to the Foreign Exchange (Forex) market. It was launched in 2000 and the portal has always been proud of their unyielding commitment to provide objective and unbiased information, to enable their users to take better and more confident decisions.