Home Bitcoin (BTC/USD) Technical Analysis: Traders who do not like too much volatility are enjoying this
Crypto News

Bitcoin (BTC/USD) Technical Analysis: Traders who do not like too much volatility are enjoying this

  • Bitcoin price nursing losses of around 0.5% in the session on Thursday.  
  • BTC/USD broke out of near-term support, this was eyed at an ascending trend line.  
  • Range trading has been observed for the past two sessions. Swinging between two dictating zones, supply and demand.
  • Supply zone seen in the $6500 region, with firm buying within the $6400 territory.  


BTC/USD 60-minute  chart  
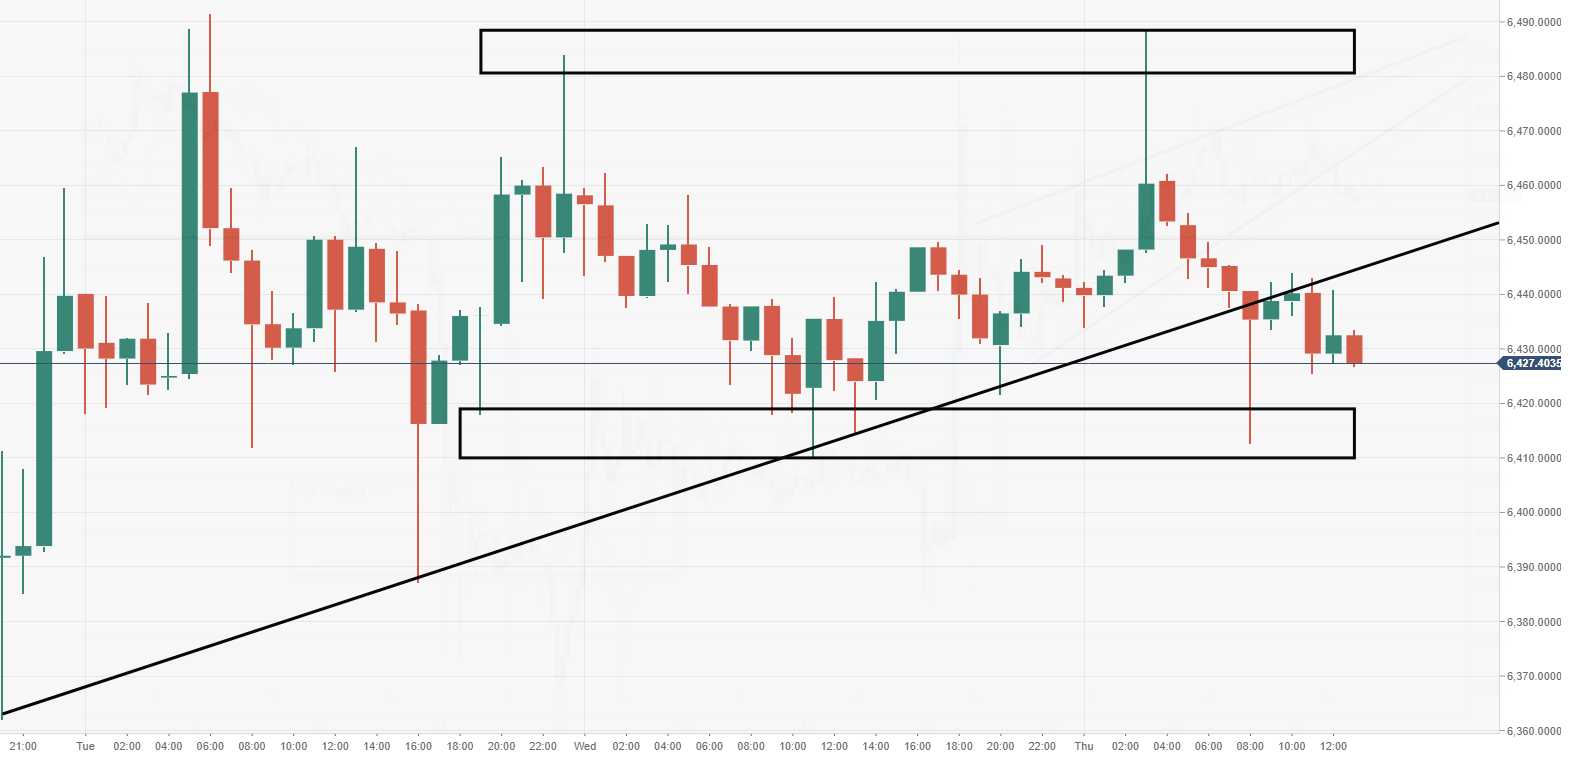


Spot rate:                   6427.8

Relative change:       -0.45%

High:                          6488.5

Low:                           6412.5


Trend:                        Bearish


Support 1:                 6420.0, support on 60-minute chart.

Support  2:                 6410.0, demand zone.  

Support  3:                 6387.2, 16 October low.  

Resistance  1:            6443.0, underneath broken trend line.  

Resistance  2:            6460.4, resistance on 60-minute chart.

Resistance  3:            6480.5, supply zone.  

FX Street

FX Street

FXStreet is the leading independent portal dedicated to the Foreign Exchange (Forex) market. It was launched in 2000 and the portal has always been proud of their unyielding commitment to provide objective and unbiased information, to enable their users to take better and more confident decisions.