Home Ripple (XRP/USD) Technical Analysis: How to trade ascending wedge pattern
Crypto News

Ripple (XRP/USD) Technical Analysis: How to trade ascending wedge pattern

  • Ripple’s XRP is seen down just shy of 1% in through the mid-point of the session.  
  • XRP/USD is broken from an ascending wedge pattern as seen on the 60-minute chart.
  • Eyes are on for the potential retest of the broken wedge, resistance underneath the pattern can be seen at $0.4825.  


XRP/USD 60-minute  chart  
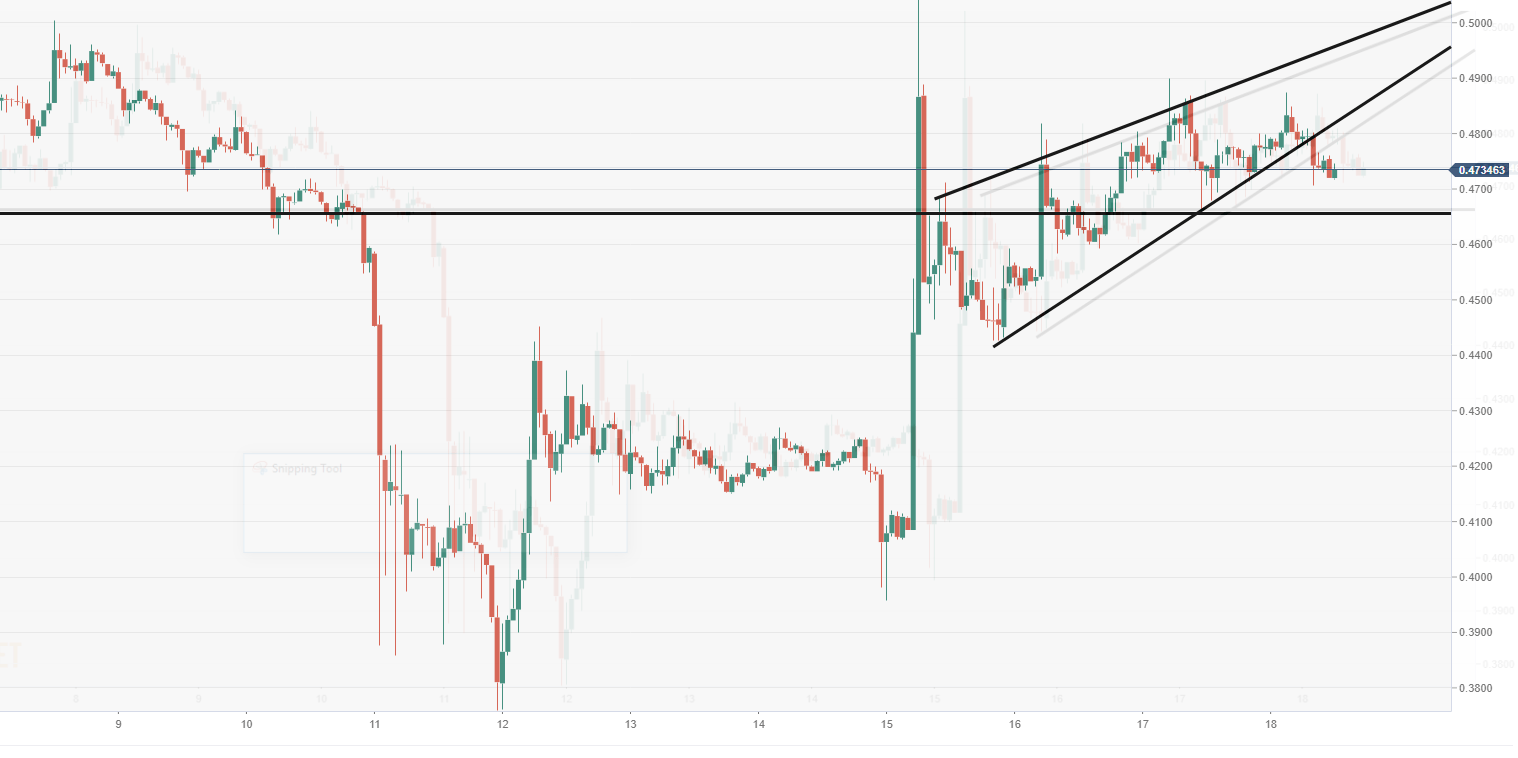


Spot rate:                   0.47302

Relative change:       -0.90%

High:                          0.49438

Low:                           0.47602


Trend:                        Bearish


Support 1:                 0.46560, support on 60-minute chart.

Support  2:                 0.44270, 15th October low.

Support  3:                 0.38800, demand zone.

Resistance  1:            0.48250, underneath broken wedge.

Resistance  2:            0.48660, resistance on 60-minute chart.

Resistance  3:            0.49400, upper trend line of wedge.

FX Street

FX Street

FXStreet is the leading independent portal dedicated to the Foreign Exchange (Forex) market. It was launched in 2000 and the portal has always been proud of their unyielding commitment to provide objective and unbiased information, to enable their users to take better and more confident decisions.