- Ethereum likely to break triangle support in the near-term.
- Technical indicators are strongly bearish on Tuesday; a fall is imminent.
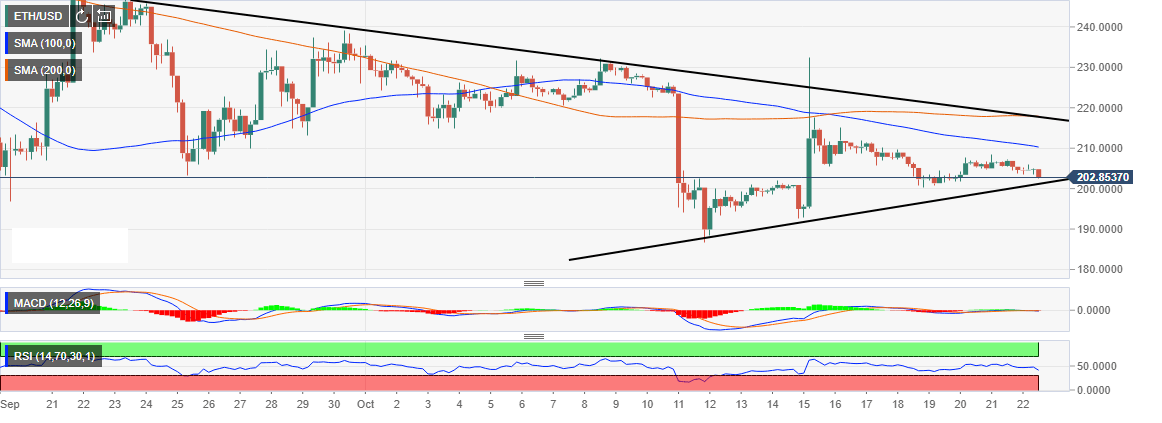
The 4-hour chart for ETH/USD shows that Ethereum is trading slightly higher compared to the levels after the declines on October 11. While Bitcoin was able to recover to $6,400 from the declines that had it test $6,000, Ethereum recovery is range-bound and limited below $220. In fact, the price has been steadily deflating in the past one week to the extent of threatening to break below $200.
Ethereum is facing immediate resistance at the 100 simple moving average currently at $210. The trend at the moment is bearish with the MACD momentum indicator unable to flipsides from the negative zone to the positive zone. The gap between the moving averages continues to increase, which means bears are gaining ground against the buyers. The RSI on the other hand, is pointing further down while towards the oversold levels.
Importantly, there is a triangle pattern that is forming on the 4-hour chart. A break above the triangle resistance coinciding with the 200 SMA will see ETH/USD attack $220 and correct higher towards $230 (key resistance). Unfortunately, the most probable break is bearish at the time of press. If this happens, Ethereum will resume the downtrend below $200 and even test the former support at $190.
ETH/USD 4-hour chart