- Ripple price was seen down 0.9% in the latter stages of trading on Monday, however bulls managed to bounce back after early selling pressure.
- XRP/USD price has edged back above a descending trend line, leaving door open for bulls to capitalize.
- Near-term big challenge will be eyed at the 38.2% Fibonacci seen just ahead, $0.4900. A rejection could be very harmful to the latest signs of recovery seen for XRP/USD.
XRP/USD 4-hour chart
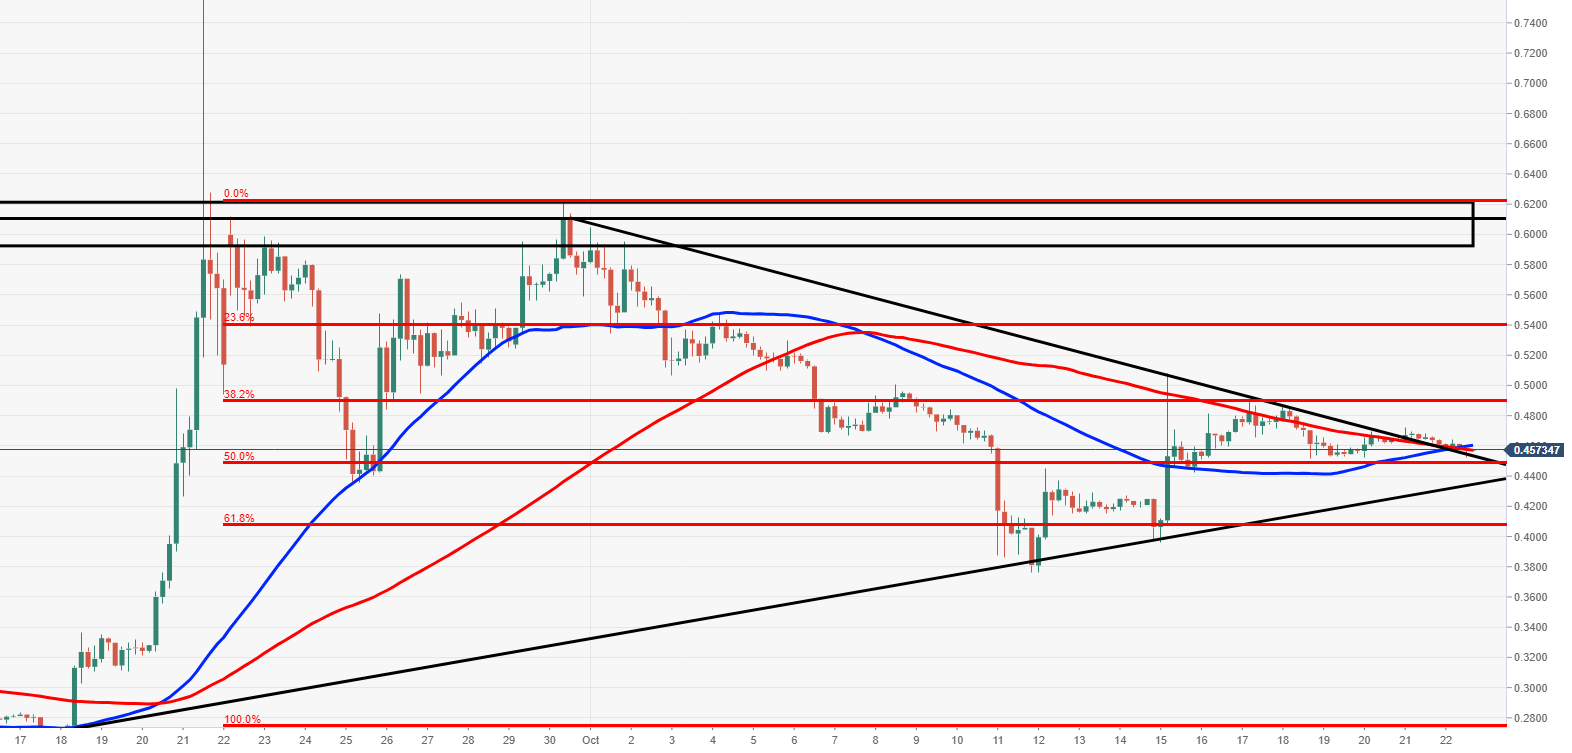
Spot rate: 0.45717
Relative change: -0.90%
High: 0.46400
Low: 0.45317
Trend: Bearish
Support 1: 0.45200, descending trend line.
Support 2: 0.44350, supporting ascending trend line.
Support 3: 0.40000, 14-15 October low area.
Resistance 1: 0.460700, 50MA (4-hour).
Resistance 2: 0.49000,resistance on 4-hour chart.
Resistance 3: 0.50760, long wick high 15 October.
