- Ethereum price seen trading firmly in the green by some 2.5%, looking to capitalize on recent breakout from bullish technical set up.
- ETH/USD broke out from a bullish flag pattern, as seen on the 4-hour chart view.
- Bullish momentum has take ETH/USD above a near-term descending trend line.
- Panel of 9 analysts via finder’s cryptocurrency report, median forecast of $261 by December & $615 by the end of the year.
ETH/USD 4-hour chart
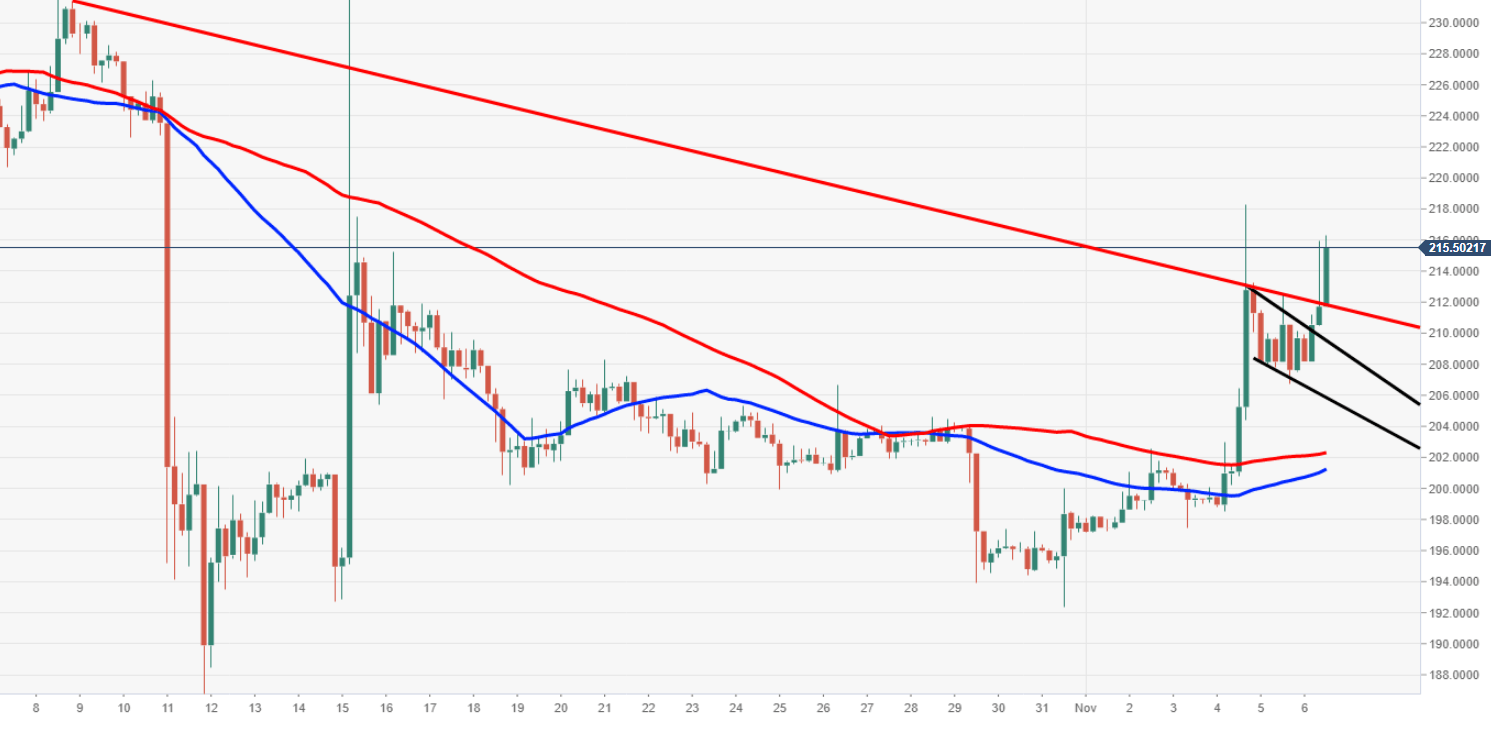
Spot rate: 214.88
Relative change: +2.48%
High: 212.45
Low: 206.76
Trend: Bullish
Resistance 1: 215.31, daily pivot point resistance.
Resistance 2: 218.18, daily pivot point resistance, 4 November high.
Resistance 3: 230.00, supply area.
Support 1: 211.94, on top of breach descending trend line.
Support 2: 206.81, daily pivot point support & lower part of bull flag.
Support 3: 203.94, daily pivot point support. .
