- Bitcoin price was trading down on Thursday, nursing losses of around 0.50%, through the mid-point of the session.
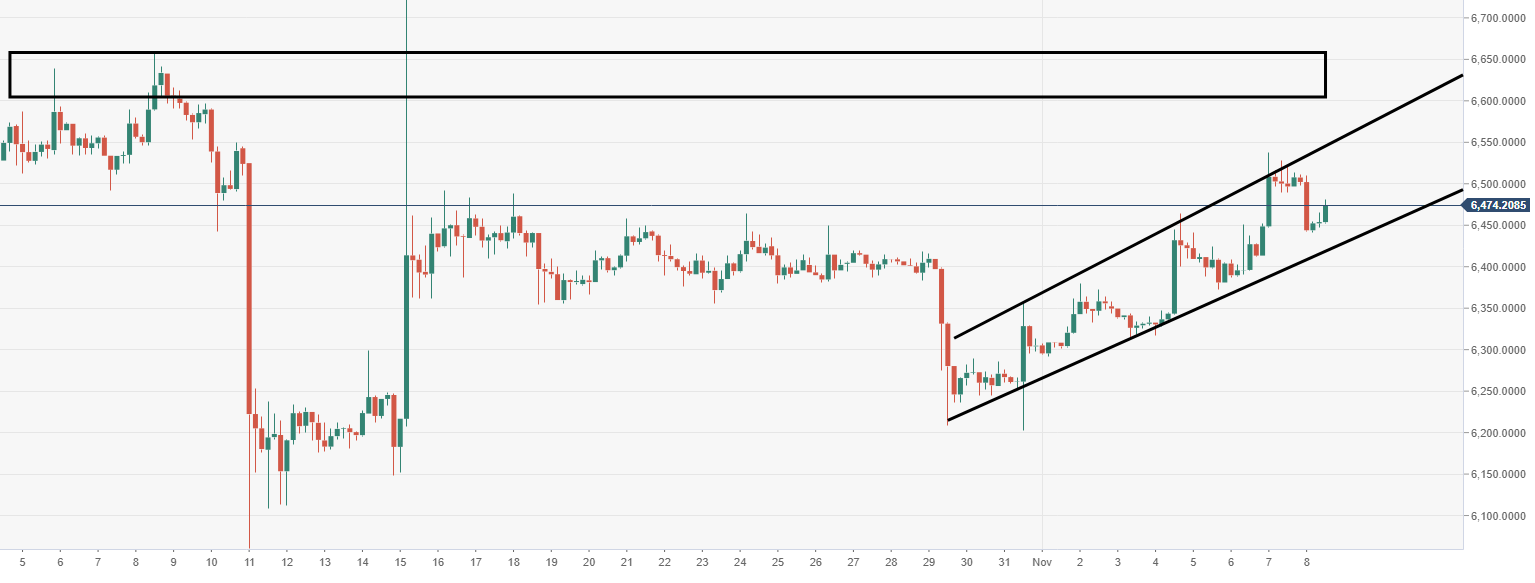
- BTC/USD price action has been moving within an ascending channel north. An attempt to breakout failed, after being rejected by upper trend line.
- Resistance is still very much firm running from $6500-600 trading range. It will take much momentum to break above.
BTC/USD 4-hour chart
Spot rate: 6466.7.
Relative change: -0.51%
High: 6443.0
Low: 6510.5
Trend: Bearish
Support 1: 6405.6, daily pivot point support. & lower trend line of channel.
Support 2: 6363.5, daily pivot point support.
Support 3: 6209.1, low area 29 & 31 October.
Resistance 1: 6544.2, daily pivot point resistance & upper trend line of channel.
Resistance 2: 6634.66, daily pivot point resistance
Resistance 3: 6657.6, 8 October high.
