- Ethereum prices descends to levels slight above $120 in yet another crypto selloff.
- For the first time, the 21 SMA drops below the 50 SMA on the weekly range.
Most cryptocurrency traders detest words such as meltdown, carnage and bloodbath. It is because sometimes these terms exaggerate the situation in the market. However, the status quo in the crypto market on Tuesday deserves all these terms. In I do not think they show the real picture of the bloody market we have today.
Ethereum has not been able to break from the downward trend since it traded highs close to $1,400 in January 2018. Consequently, the weekly chart shows that for the first time, the 21 SMA has crossed below the 50 SMA. At the time of writing Ethereum price has plunged 9.27% after it slipped below $150. The price has recorded lows of $124.25 on the day but has corrected above $130.
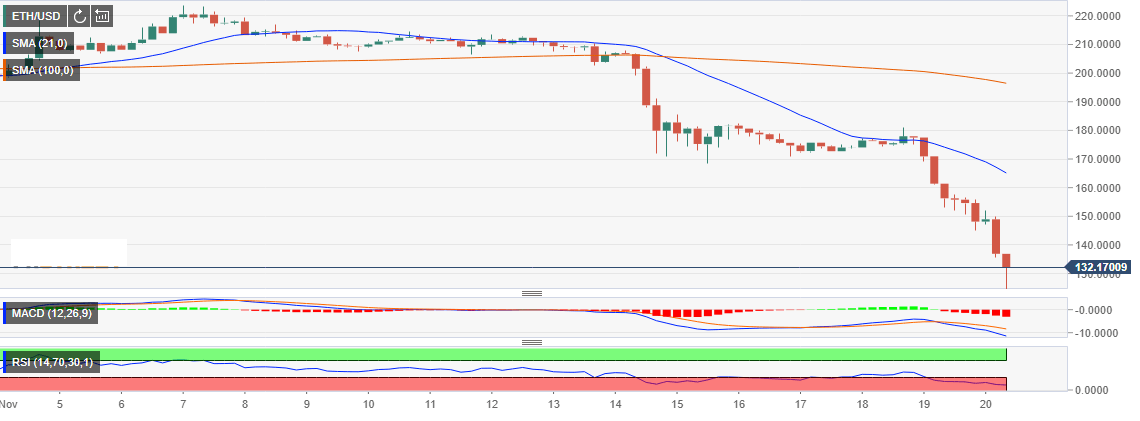
Indicators on a 4-hour range show that the slope is not over and Ethereum could resume the trend towards $100. The MACD is moving further into the negative territory since the drop below the mean line started on November 10th. At the moment, the MCAD is at -11.42, likewise the RSI indicates that ETH/USD has reached the oversold levels and therefore trading below its market value. A recoil is needed immediately before the bears drag the third digital asset by market capitalization below $100.
ETH/USD 4-hour chart