- Ripple’s XRP down a chunky 0.5% into the second half of the session.
- XRP/USD price action was moving within an ascending channel, which has since been breached to the downside.
- Eyes will likely once again be on next major area of support down towards $0.4100-0.4000.
XRP/USD 60-minute chart
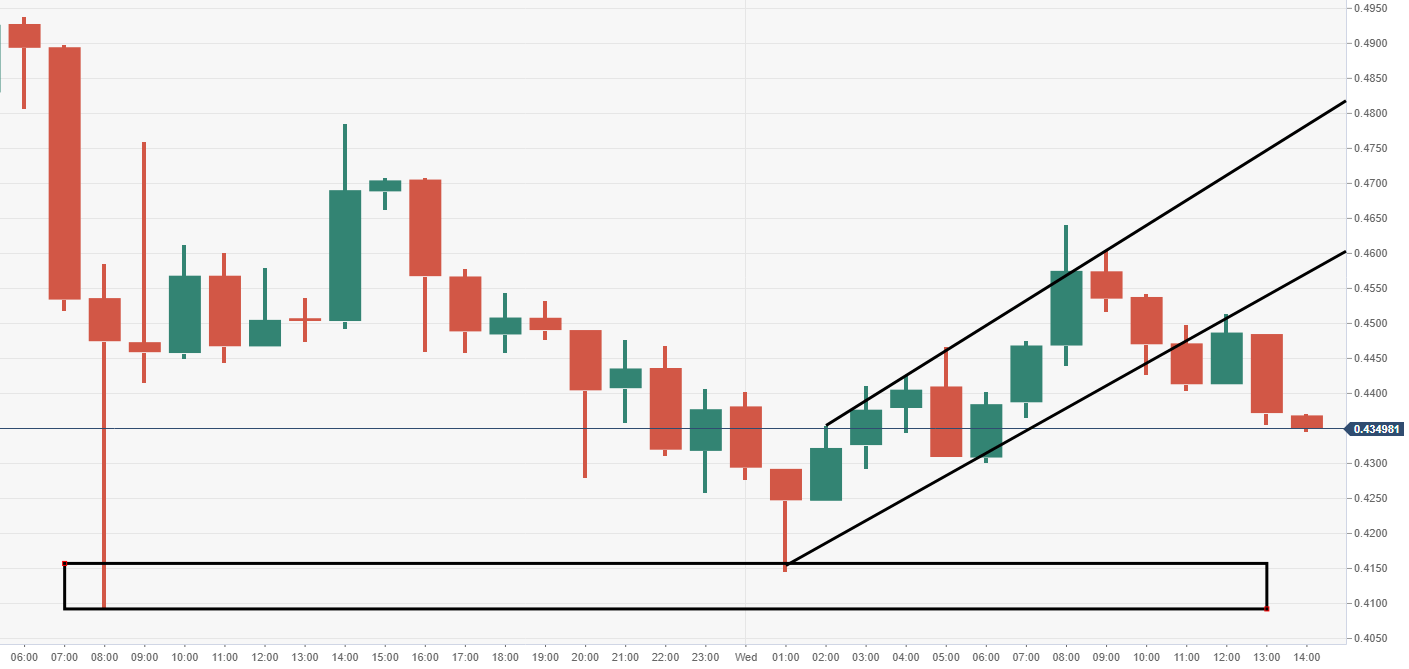
Spot rate: 0.4641
Relative change: -0.50%
High: 0.4641
Low: 0.4146
Trend: Bearish
Support 1: 0.4150, demand area.
Support 2: 0.3970, daily pivot point support.
Support 3: 0.3562, daily pivot point support.
Resistance 1: 0.4550, underneath breached channel.
Resistance 2: 0.4911, daily pivot point resistance.
Resistance 3: 0.5444, daily pivot point resistance.
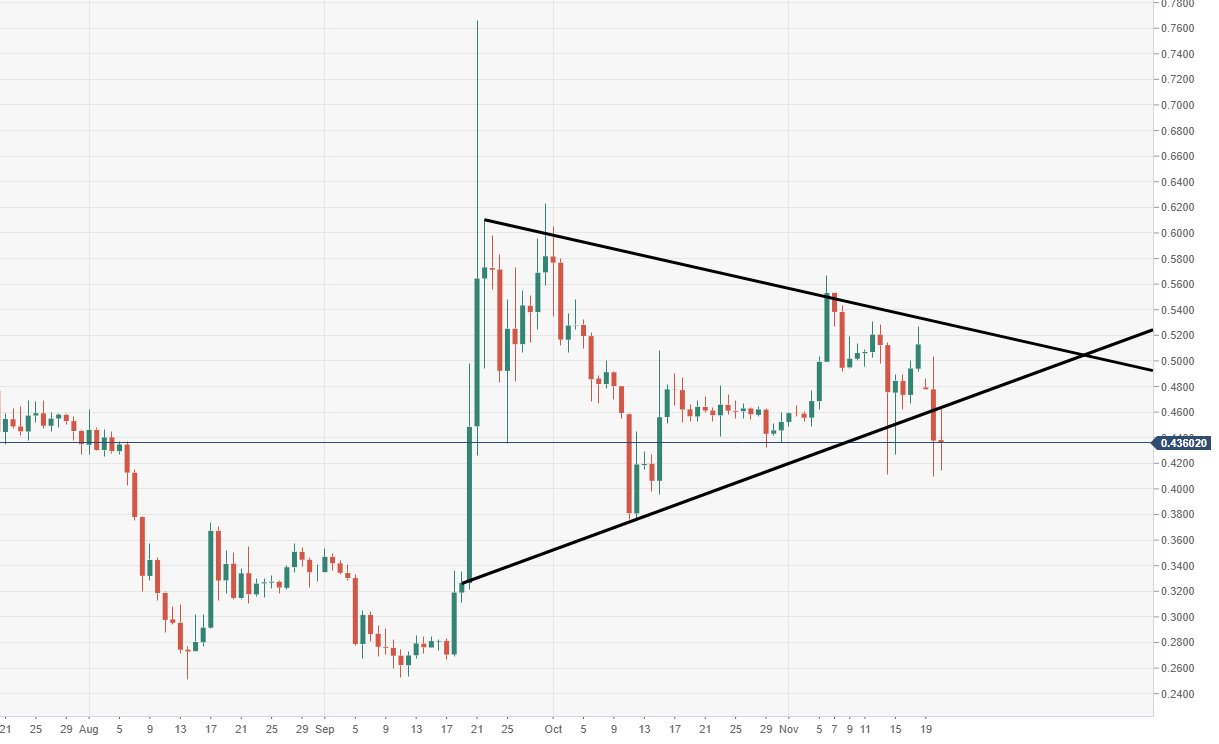
XRP/USD daily chart
- XRP/USD price moving underneath a breached pennant pattern via the daily view, leaving it vulnerable to further downside.